These screens display the data of a General Engine
Module (order No. 33610) or a General Air Module
(order No. 33611) that may be connected to the re-
ceiver. Further information on the modules can be
found in the Appendix (page 234) and on the Internet
atwww.graupnerusa.com.
Depending on the module configuration with addi-
tional sensors, the following data can be permanently
shown on the display:
1. Display
At the top edge of the screen, the QUA line shows
(in percent) the quality of the signal coming from the
transmitter.
The graphic at the top left shows (in rotations per min-
ute) the speed detected by a speed sensor connected
to the module. The graphic at the top right shows (in
milliampere hours) the remaining charge of the con-
nected battery.
Notice
To correctly display the data,the relevant number
of propellers and thebattery charge information
must be entered beforehand in the FUNCTION
submenu Telemetry.
The graphic at the bottom left shows (in volts) the
current voltage of the battery connected to the mod-
ule. The graphic at the bottom right shows (in amps)
the momentary flow of current. The graph along the
right edge of the display shows (in meters) the present
height relative to the location.
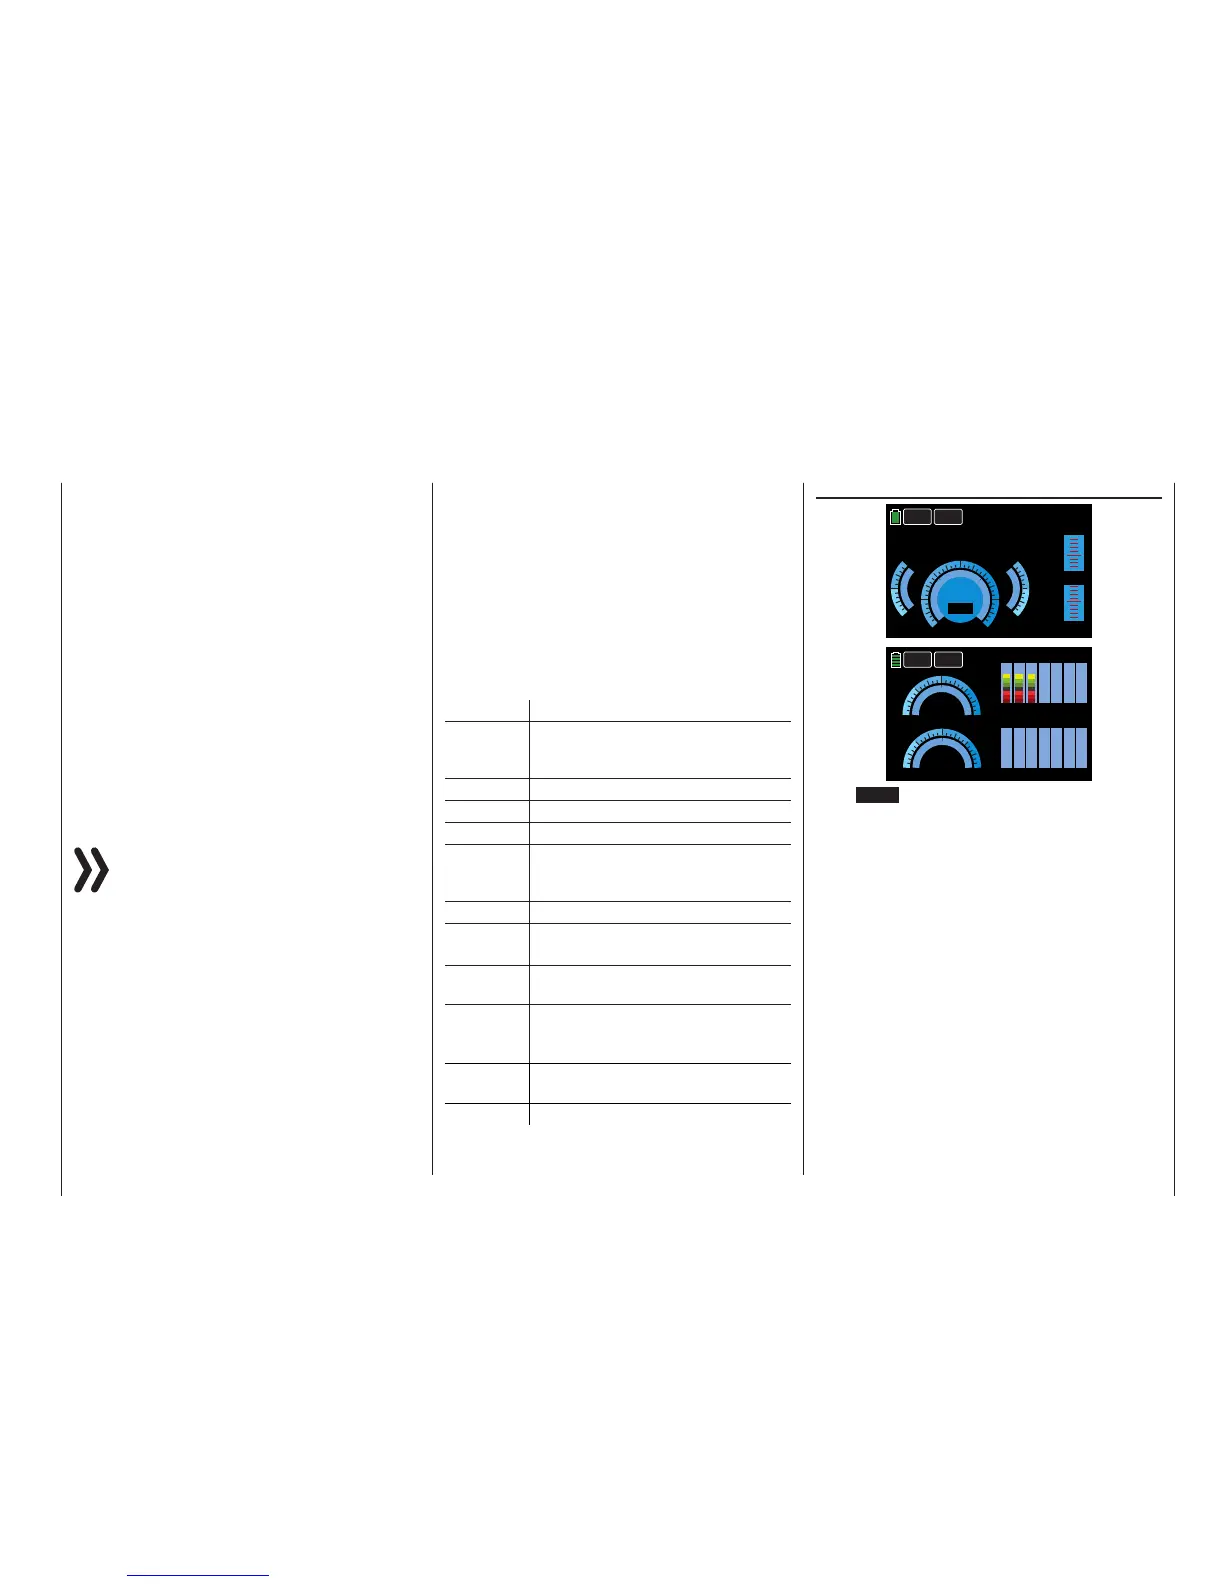
2. Display
At the top edge of the screen, the m/ s and m/3 s
lines show (in meters per second and meters per ev-
ery three seconds) the current ascent/descent of the
model.
The two graphics to the left show the current voltage
measured by the temperature and voltage sensors
(No. 33612 and 33613) connected to the model from
up to two batteries (BAT-1 and BAT-2). They also
show the corresponding temperature: the arc’s left
side shows sensor 1 data and the arc’s right side
shows sensor 2 data.
The bar graph in the top right of the display shows the
current cell voltages of up to six lithium polymer bat-
tery cells. Below that in the bottom right of the display
is a graph showing (in milliliters) the cumulative fuel
consumption measured by a sensor connected to the
module.
Value Explanation
1-BAT-2 Battery 1 data is shown on the arc’s
left side of the arc; Battery 2 data is
shown on the arc’s right side
QUA Signal quality (in percent)
FUEL Fuel level/tank display
ml Fuel consumption (in milliliters)
1-TEMP-2 Sensor 1 temperature is shown on the
arc’s left side; Sensor 2 temperature is
shown on the arc’s right side
BAT1 Cell voltage of cells 1 - max. 6
ALT Current altitude
- available only with model 33611
m/s Ascent/descent (in meters per second)
- available only with model 33611
m/3s Ascent/descent (in meters per three
seconds)
- available only with model 33611
VOLT Current voltage of the battery con-
nected to the module
AMP Momentary current (inamps)
ELECTRIC AIR MODULE
m/s -000.1m/s
CURRENT
QUA 100
000.0A
40.0
80.00
0000m
ALT
VOLT
00000mAh
00.0V
60.020.0
CAPACITY
m/3s 000m/3s
BACK
NEXT
RPM 000000
00.0V 00.0V
1-BAT-2
BAT 1
80.0
70
0
0
3.0V
-20
0.0
-20
-020°C -020°C
1-TEMP-2
2525
40.0 40.0
0.0
0.03.8
Z6
Z5
Z4
Z3
Z2
Z1
Z7
BAT 2
3.0V
0.0
0.0
0.0
0.0
0.0
0.0
Z6
Z5
Z4
Z3
Z2
Z1
Z7
0.0
0.0
4.2V
4.2V
BACK
NEXT
3.7
3.8
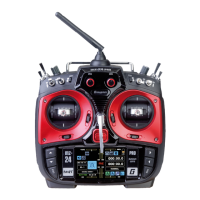
Press NEXT to switch between screen displays.
These two screens display the data of an ElectricAir
Module connected to the receiver (No. 33620). Fur-
ther information on the modulescan be found in the
Appendix (page 234) and on the Internet at www.
graupnerusa.com.
Depending on the configuration of the module with
additional sensors, the following data can be perma-
nently shown on the display:
1. Display
At the top edge of the screen, the QUA line shows
(in percent) the quality of the signal coming from the
transmitter. Directly below the QUA line is the m/ s
and m/3 s line, showing (in meters per second and
meters per every three seconds) the current ascent/
descent of the model.
The graph along the right edge of the display shows
(in meters) the present height relative to the location.
The central graphic shows the current voltage of the
connected battery. The scale to the left shows the mo-
mentary CURRENT in amps, and the scale to the right
227
Telemetry data display
 Loading...