shows the momentary CHARGE of the power source
connected to the module at the battery connection.
Notice
To correctly display the data,thebattery charge
information must be entered beforehand in the
FUNCTION submenu Telemetry.
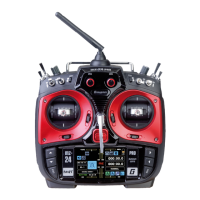
2. Display
The two graphics to the left show the current voltage
measured by the temperature and voltage sensors
(No. 33612 and 33613) connected to the model from
up to two batteries (BAT-1 and BAT-2). They also show
the corresponding temperature: the arc’s left side
shows sensor 1 data and the arc’s right side shows
sensor 2 data.
The bar graph in the top right of the display shows the
current cell voltages of the (max.) 7-cell battery pack
connected to balancer port 1 (L) and port 2 (H).
Value Explanation
QUA Signal package quality (in percent) of
data sent from the transmitter arriving
at the receiver
m/s Ascent/descent (in meters per second)
m/3s Ascent/descent (in meters per three
seconds)
A Actual current
V Actual voltage
mAh Battery capacity (in milliampere hours)
ALT Current altitude
1-BAT-2 Battery 1 data is shown on the arc’s
left side of the arc; Battery 2 data is
shown on the arc’s right side
1-TEMP-2 Sensor 1 temperature is shown on the
arc’s left side; Sensor 2 temperature is
shown on the arc’s right side
BAT1-BAT2 Cell voltage of cells 1 - max. 14
L = Balance port 1
H = Balance port 2
VARIO
m/s
270.0
QUA 100
-270.0
-000.5
-0001m
m/3s
270.0
-270.0
+000.1
m/10s
270.0
-270.0
000.0
-0002m
MIN
MAX
0000m
BACK
NEXT
This screen displays the data from a Vario mod-
uleconnected to the receiver (No. 33601).
Value Explanation
QUA Signal package quality (in percent) of
data sent from the transmitter arriving
at the receiver
MAX Maximum level (in meters) relative to
thestarting location
MIN Maximum altitude (in meters) below the
starting location
m/s Ascent/descent (in meters per second)
m/3s Ascent/descent (in meters per three
seconds)
m/10s Ascent/descent (in meters per ten
seconds)
GPS
N 000°00 0000
m/s
QUA 100
000.0
200
4000
0000m
DIST
SPEED
000
000km/h
300100
m/3s
W 000°00 0000
00000m
ALT
000
BACK
NEXT
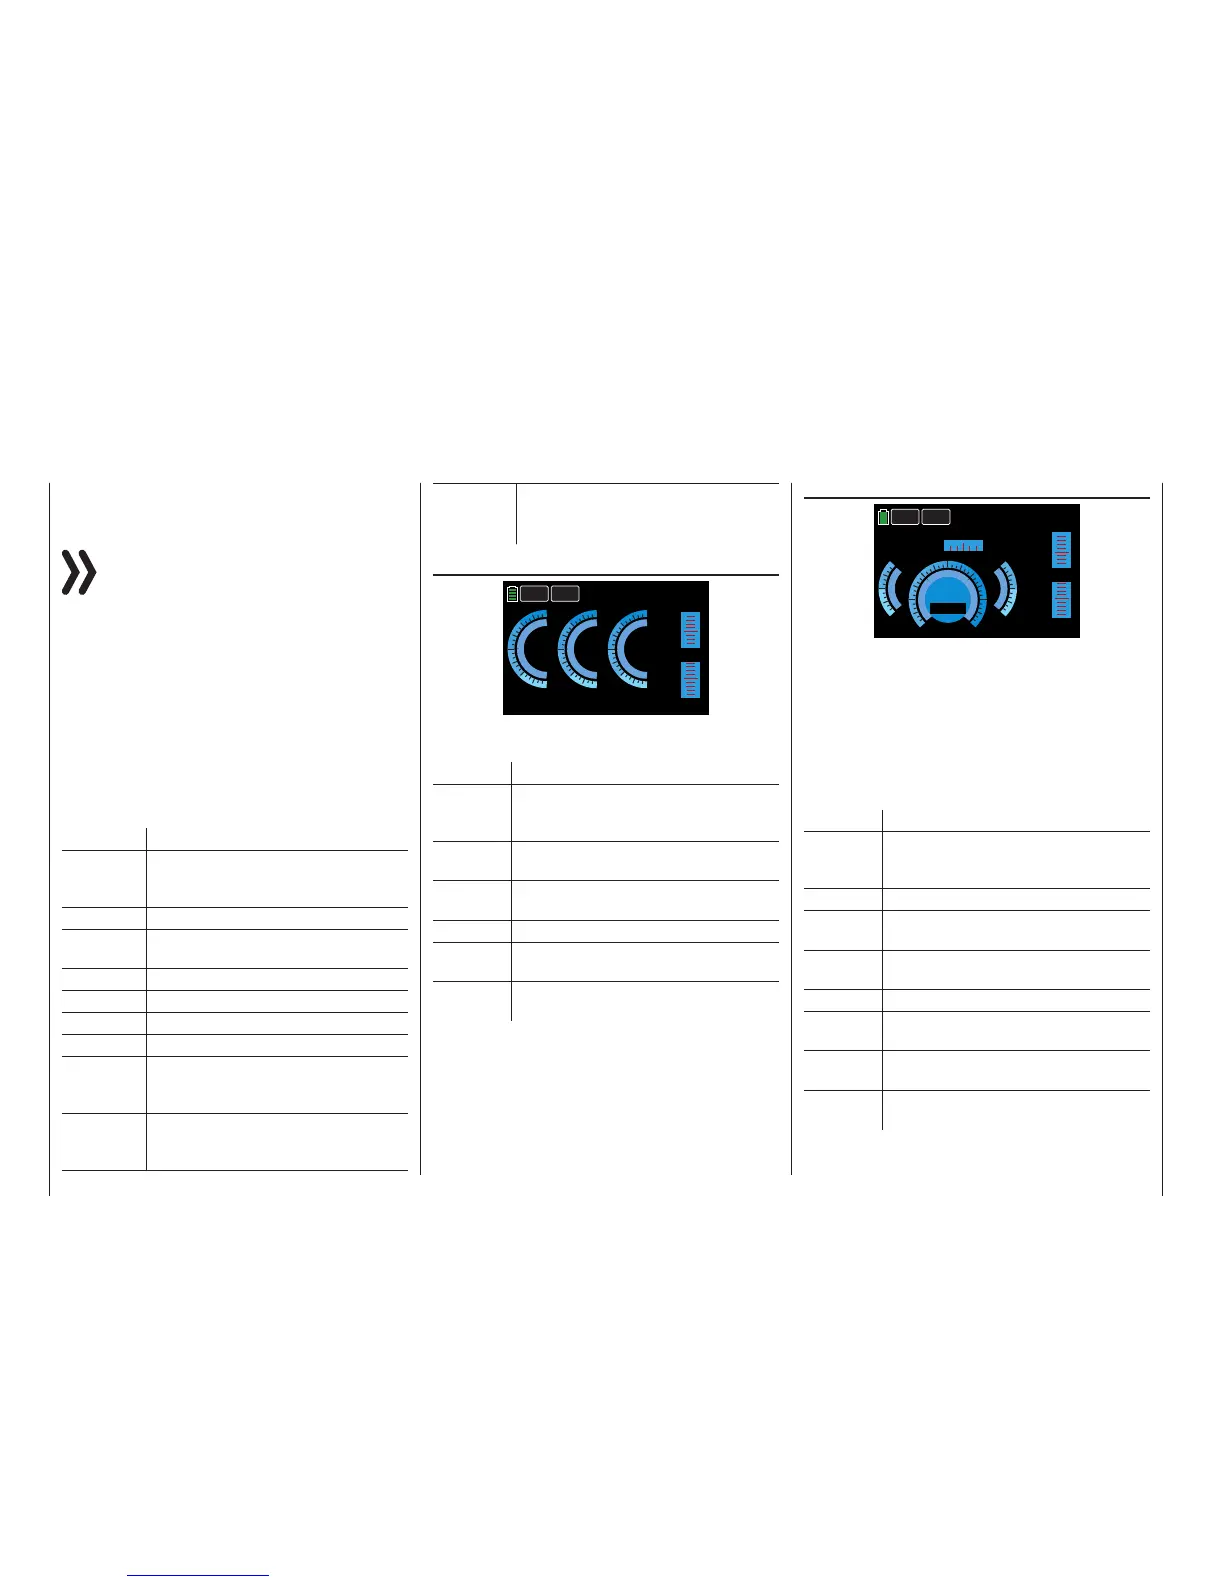
This display shows the data from aGPS module with
an integrated Vario moduleconnected to the receiver
(No. 33600).
In addition to the current position data and model
speed in the center of the display, the current height
is displayed in relation to the starting location along
with the ascent and descent of the module in m/ s and
m/3 s; the current reception as well as the distance
from the starting location are also shown.
Value Explanation
QUA Signal package quality (in percent) of
data sent from the transmitter arriving
at the receiver
DIST Distance (in meters)
N North/South coordinates in degrees,
minutes and seconds (dd°mm ssss)
W West/East coordinates in degrees, min-
utes and seconds (dd°mm ssss)
m/s Ascent/descent (in meters per second)
m/3s Ascent/descent (in meters per three
seconds)
km/h Above-ground speed (in kilometers per
hour) calculated by the GPS system
ALT Current altitude relative to starting
location
228 Telemetry data display
 Loading...