9
TITRATION THEORY
2.2 Titrations According to The Reaction Type
2.2.1 Acid-Base Titrations
Acid–base titrations are the most common type of titrations. They are based upon a reaction
between an acid and a base, a stoichiometric neutralization, or the exchange of protons.
Virtually all acid-base titrations are carried out using a strong acid or a strong base as the
titrant. The endpoint of a titration carried out with a weak acid or a weak base would be
difficult to detect due to a small change in pH at the equivalence point.
Chemical indicators can be used to determine the endpoint. The indicator will change color
to signify that the end of the titration has been reached. The color of the indicator is dependent
upon the concentration of ions in the solution. An acid-base indicator is composed of a
conjugate weak acid-weak base pair, where the two forms exhibit different colors depending
on the pH of the solution. For an indicator, the acid ionization constant K
a
is usually written
as:
[H
3
O
+
][In
–
]
K
a
=
[HIn]
HIn is the acid form of the indicator and
In
–
is the base form. At the center of the
change region, the ratio of [In
–
] to [HIn]
is one, [H
3
O
+
]=K
a
and pH=pK
a
. The color
change region is usually ±1 pH unit around
this point. Table 1 contains a list of some
aqueous acid-base chemical indicators, as
well as the pH range, the pK
a
and the
expected color (acid and base form). When
choosing the proper indicator you should
select one that has a pK
a
as close to the
endpoint of the titration.
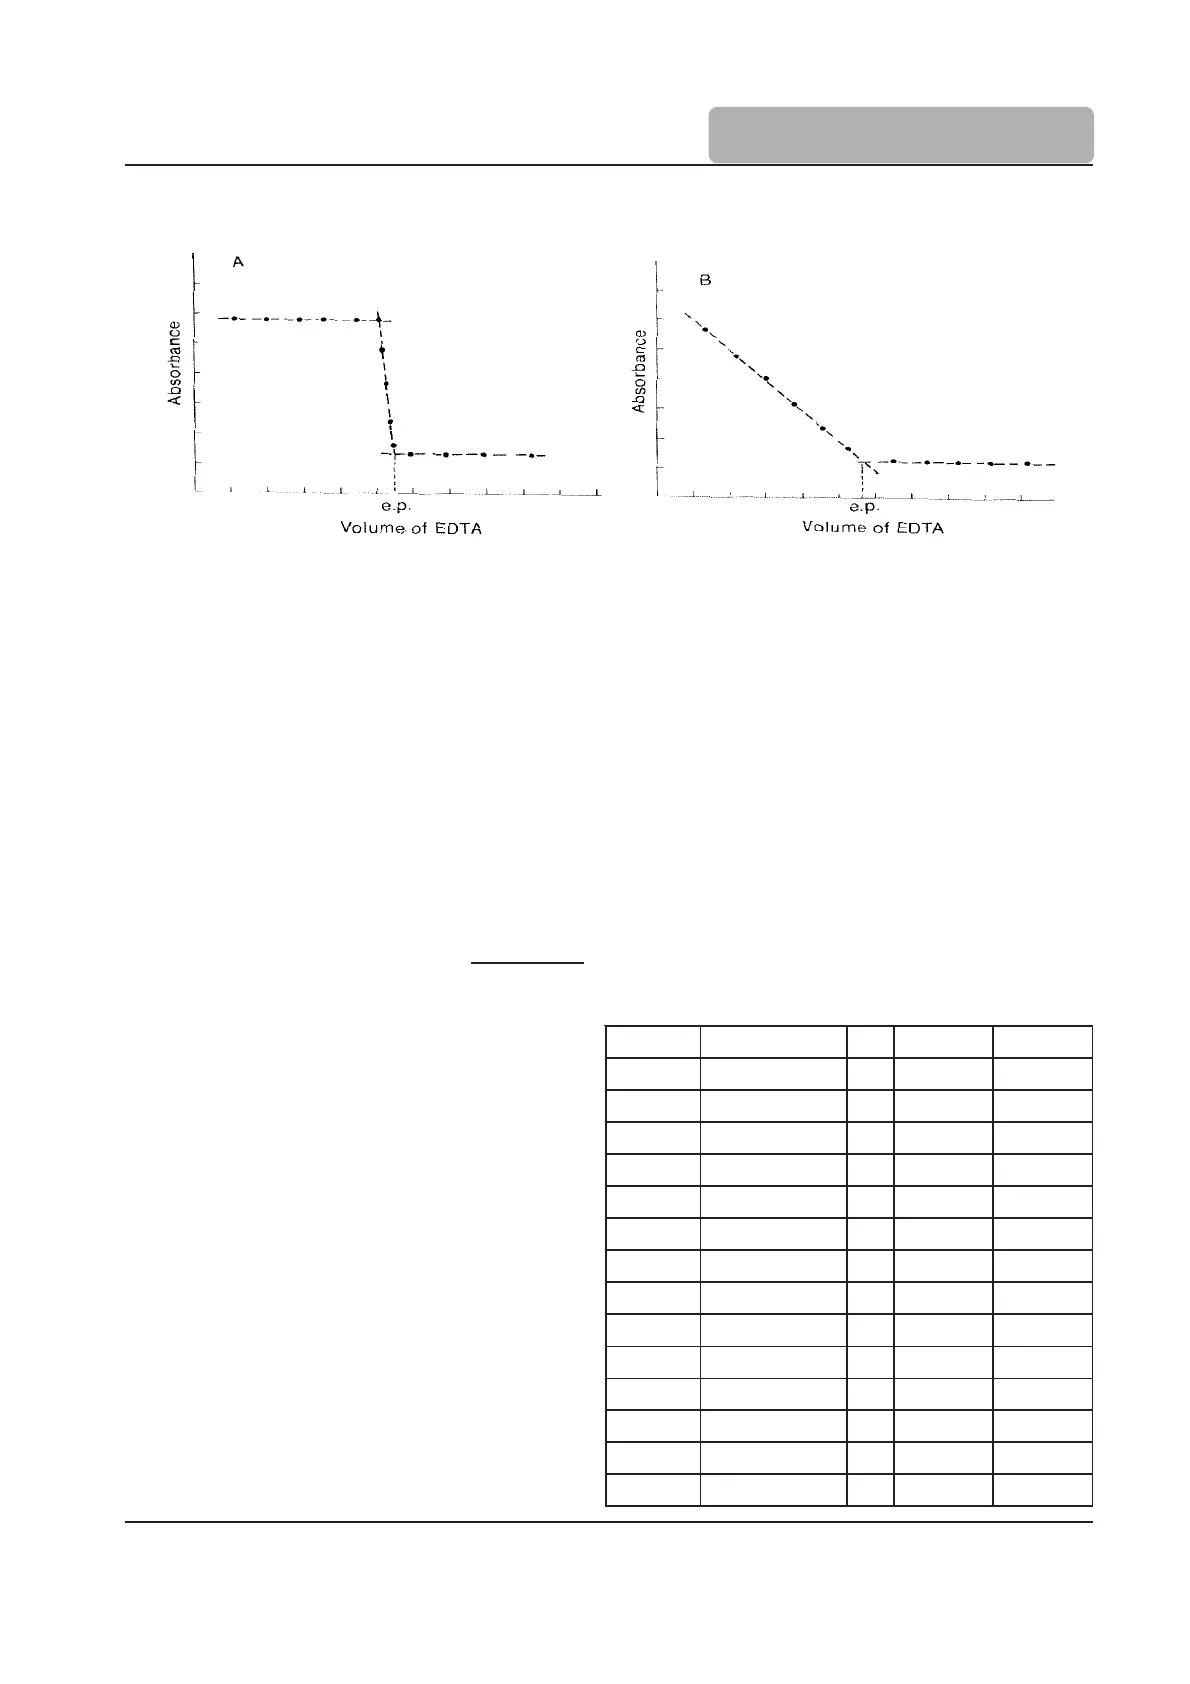
When chemical indicators are not suitable,
a potentiometric pH titration can also be
used. The pH of the solution is plotted
versus the volume of titrant added. Figure
4 shows a traditional strong acid-strong
base titration curve. The graph shows the
Figure 3
egnaRHp rotacidnI
aKp
mroFdicA mroFesaB
6.1-0.0 teloiVlyhteM wolleY eulB
8.2-2.1 eulBlomyhT 56.1 deR wolleY
4.4-2.3 egnarOlyhteM 64.3 deR wolleY
4.5-8.3 neerGlosercomorB 09.4 wolleY eulB
0.6-8.4 deRlyhteM 00.5 deR wolleY
8.6-2.5 eulBlonehporolhC 52.6 wolleY deR
6.7-0.6 eulBlomyhtomorB 03.7 wolleY eulB
0.8-6.6 deRlonehP 00.8 wolleY deR
0.9-4.7 elpruPlosercateM 03.8 wolleY elpruP
6.9-0.8 eulBlomyhT 02.9 wolleY eulB
0.01-2.8 nielahthplonehP 05.9 raelC kniP
6.01-4.9 nielahthplomyhT raelC eulB
0.21-1.01 RwolleYnirazilA wolleY deR
6.21-4.11 enimraCogidnI eulB wolleY
Table 1
 Loading...