Once values for the two coefficients (a, b) are recorded in the analyzer memory, the Element DC performs compensation
calculations internally using the formula:
X = (Y-b)/a
In this way, the Element DC’s measured data (Y) are adjusted to match those that would be obtained using your
instruments with the conventional method.
NOTE: In order to obtain a better correlation, it is essential to exercise caution regarding the amount of data and the
sample.
(mg/dL)
600
600 10 0
0
X
Y=0.98X + 5
(mg/dL)
Measurement using
your instruments
Example printout
Value below
the measurement
range
Value above
the measurement
range
FUJI DRI-CHEM
®
reference
(mg/dL)
(mg/dL)
Measurement using
your instruments
Example printout
Value below
range
Value above
range
FUJI DRI-CHEM
®
reference
600 10 0
0
X
Y=X
Y=1.1X - 5
1. It is able to set separate a and b values for each different
sample type.
2. The correlation function is independent of other compensation
functions.
3. If values for (a, b) have already been input, old values will not
be canceled as follows. If the old values are represented as (a1,
b1), and the new values as (a2, b2), the resulting values for (a, b)
will be determined according to the following formulas:
a = a1 x a2
b = a1 x b2 + b1
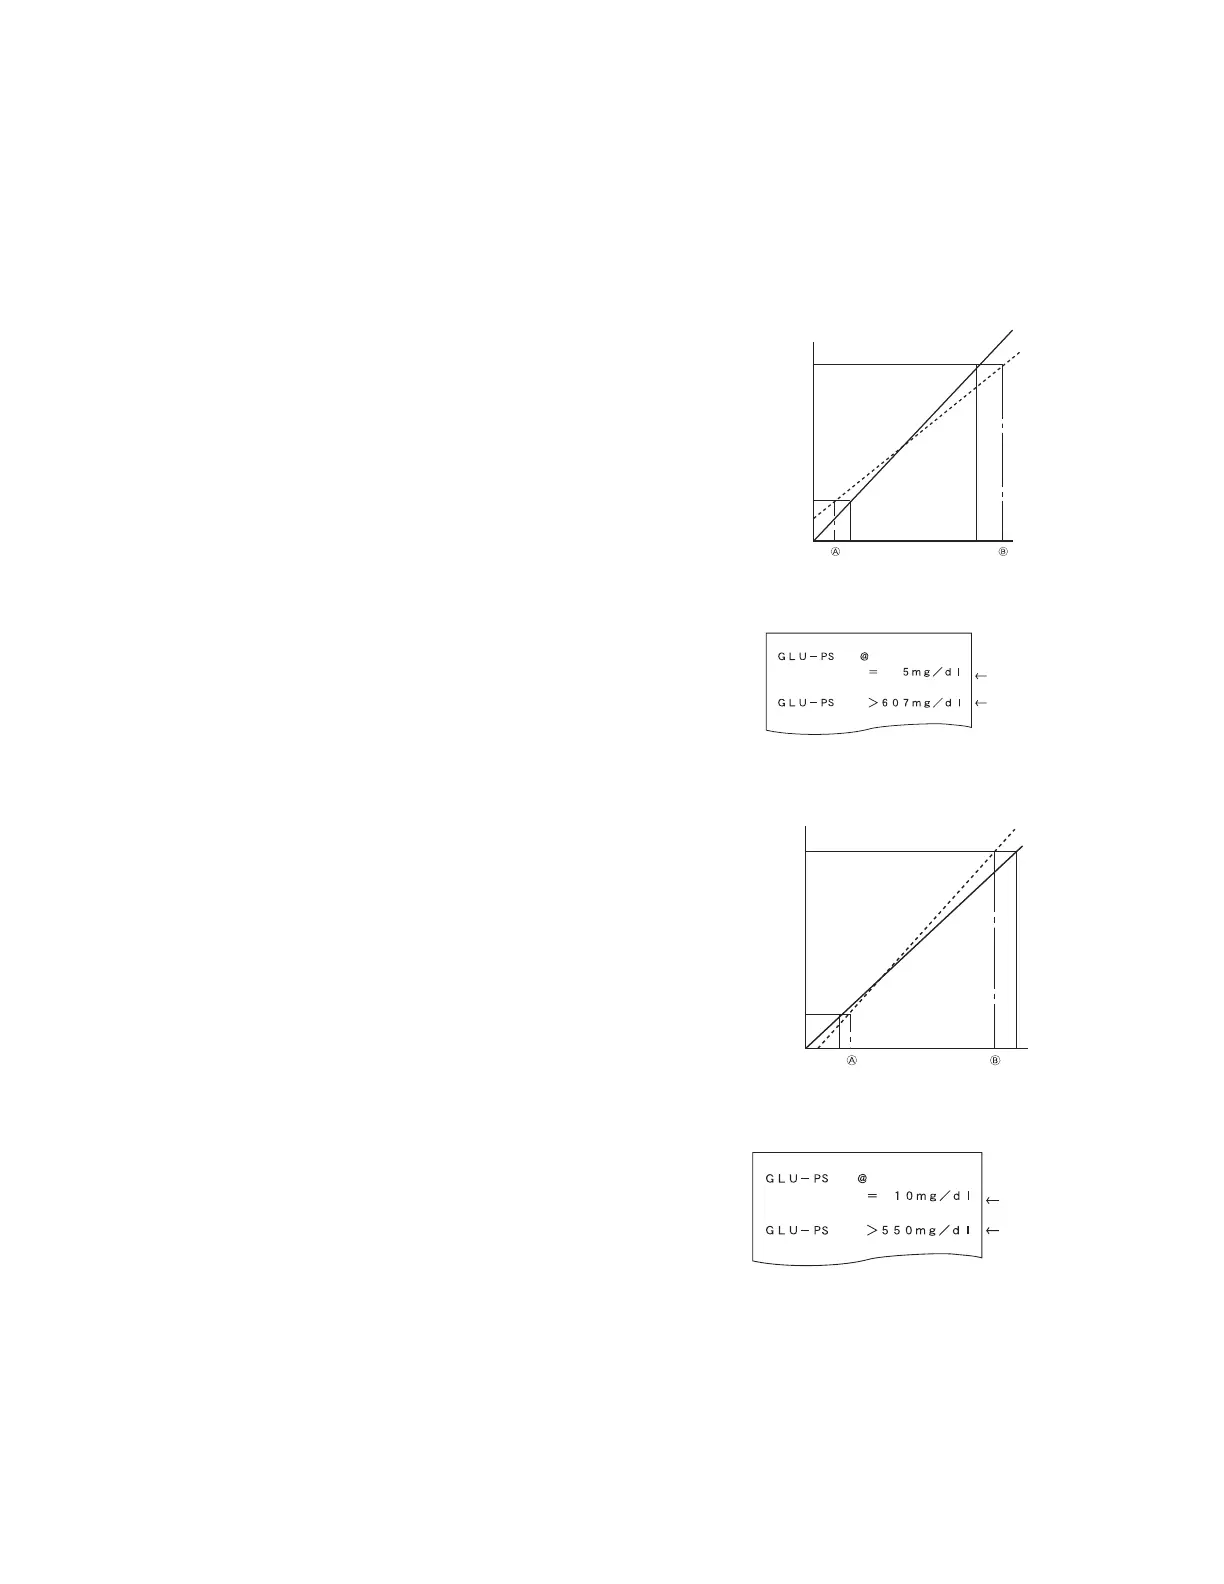
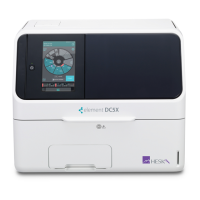
4. Measurement range after inputting coefficients (a, b).
Depending on the values input for (a, b), the apparent limits
of the measurement range will shift as follows.
(Example) GLU measurements
If a = 1 and b = 0 (Y = X), the measurement range is 10–600 mg/
dL. But by inputting regression coefficients as shown, the lower
limit changes to A and the upper limit to B.
If the regression formula is Y = 0.98X + 5:
A = 5 mg/dL
B = 607 mg/dL
If the regression formula is Y = 1.1X -5:
A = 14 mg/dL
B = 550 mg/dL
If the measured data is below the measurement range, a “@”
indication is printed out, as shown at the top of the example
printout.
If the measured data is above the measurement range, a greater-
than indication “>” is printed out, as shown in the example
printout.
107