Setup Manual Page 135
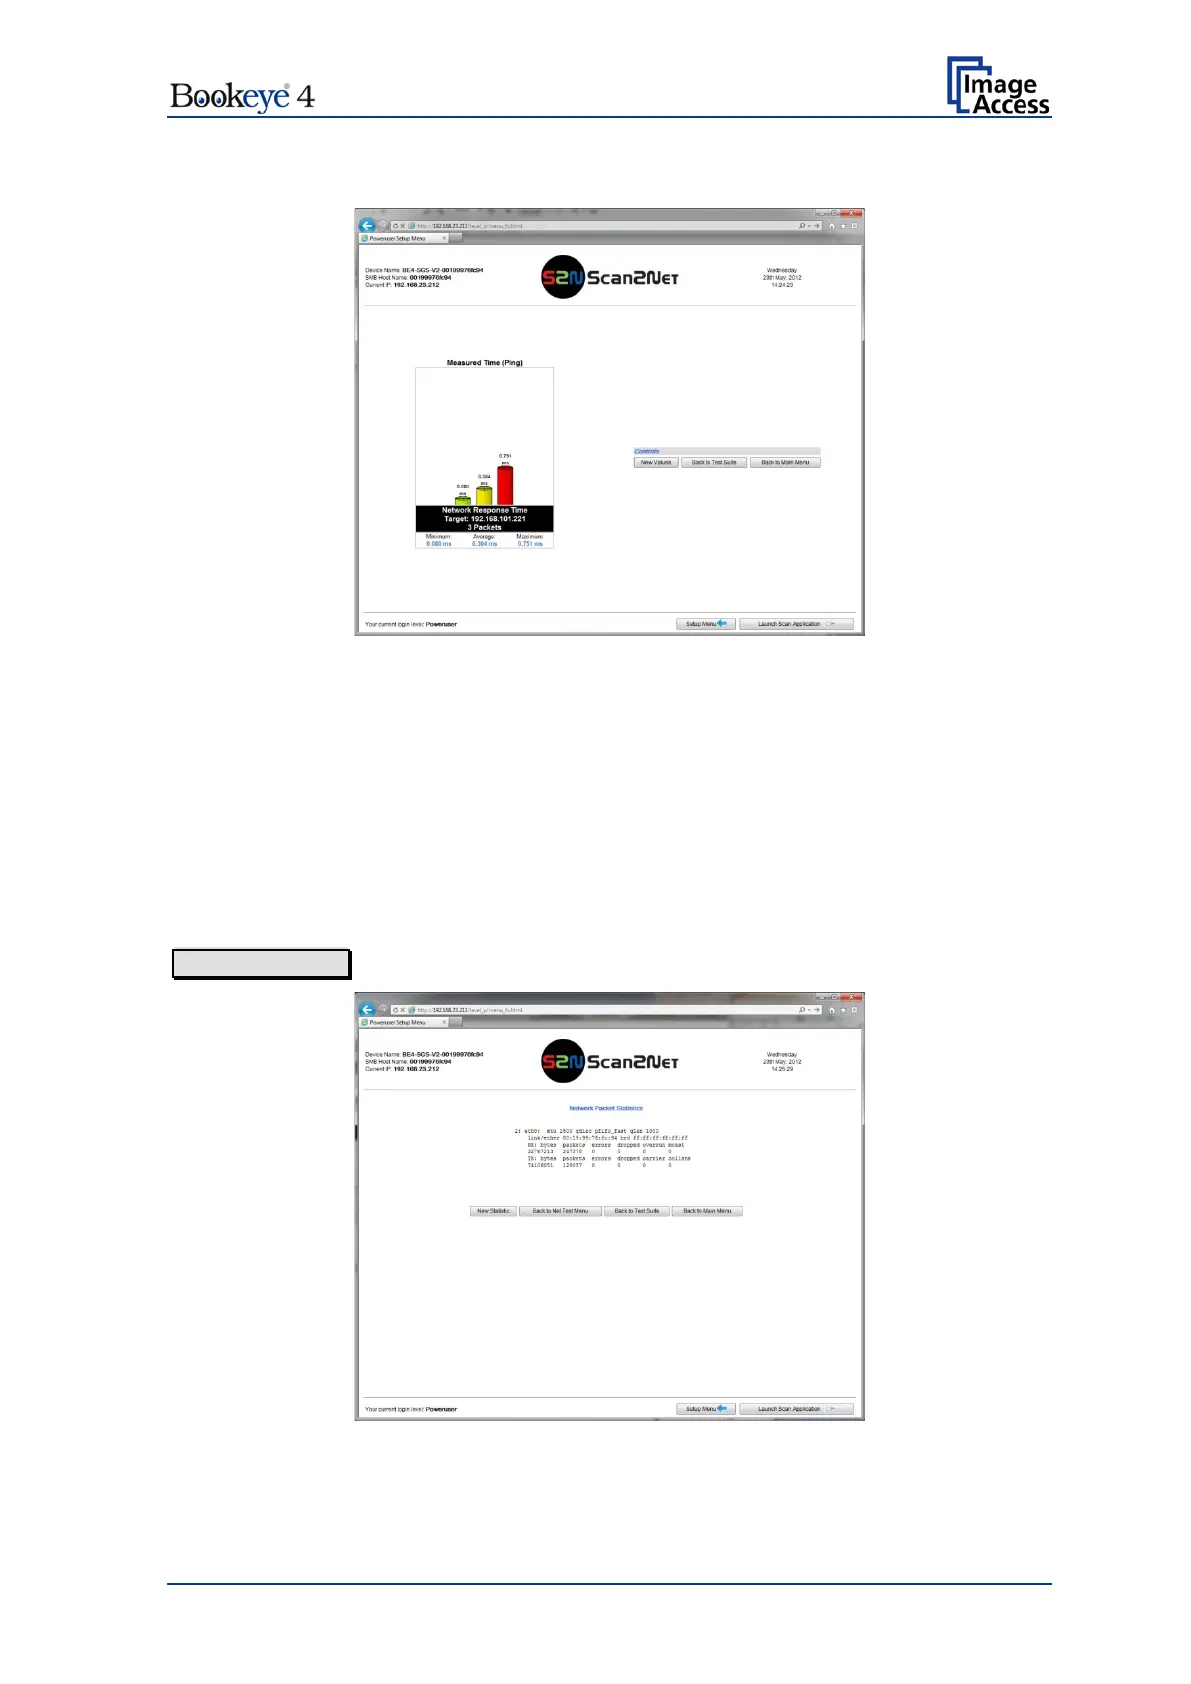
The result of the measurement is displayed at the next screen.
Picture 124: Measured Time
The bar graphic shows the three values:
Minimum The fastest transfer time between the scanner and the target address.
Average The average time for all transferred packets.
Maximum The maximum transfer time during the test.
Depending at the transfer time, the color of the bar changes.
D.6.4.1.2 Packet Statistics
Packet Statistics Shows the current network packet statistics.
Picture 125: Packet Statistics values
 Loading...