The conventions for this graph are:
• Atrial, Ventricular and LS events are displayed as vertical lines under the
horizontal axis of the graph.
• Sensing thresholds are displayed as small rectangles below the sensed
events. The distance to the axis is proportional to their values.
• LS Refractory periods are displayed as light blue rectangles of the
corresponding width with a dotted line edge.
• LS Alert Window is displayed as a light yellow rectangle of the
corresponding width with a dotted line edge.
• The CCM Pulse Train is displayed as a square wave.
• The balance phase is displayed as a green zone.
• The noise window is displayed as a light red zone.
• For LS events that fall outside the graph, their time of occurrence is
indicated in a gray zone located on the left of the graph.
12.3.2.1 Dynamic View
In the Dynamic View, one period of the current ECG is shown alongside
the (graphic) parameters appearing as described above, together with
Marker Events. The Dynamic View is available only if the Marker Mode
is on. No modification of parameter values is allowed in this view. If an
attempt to modify a parameter value is made, the graph mode
automatically switches to Static View.
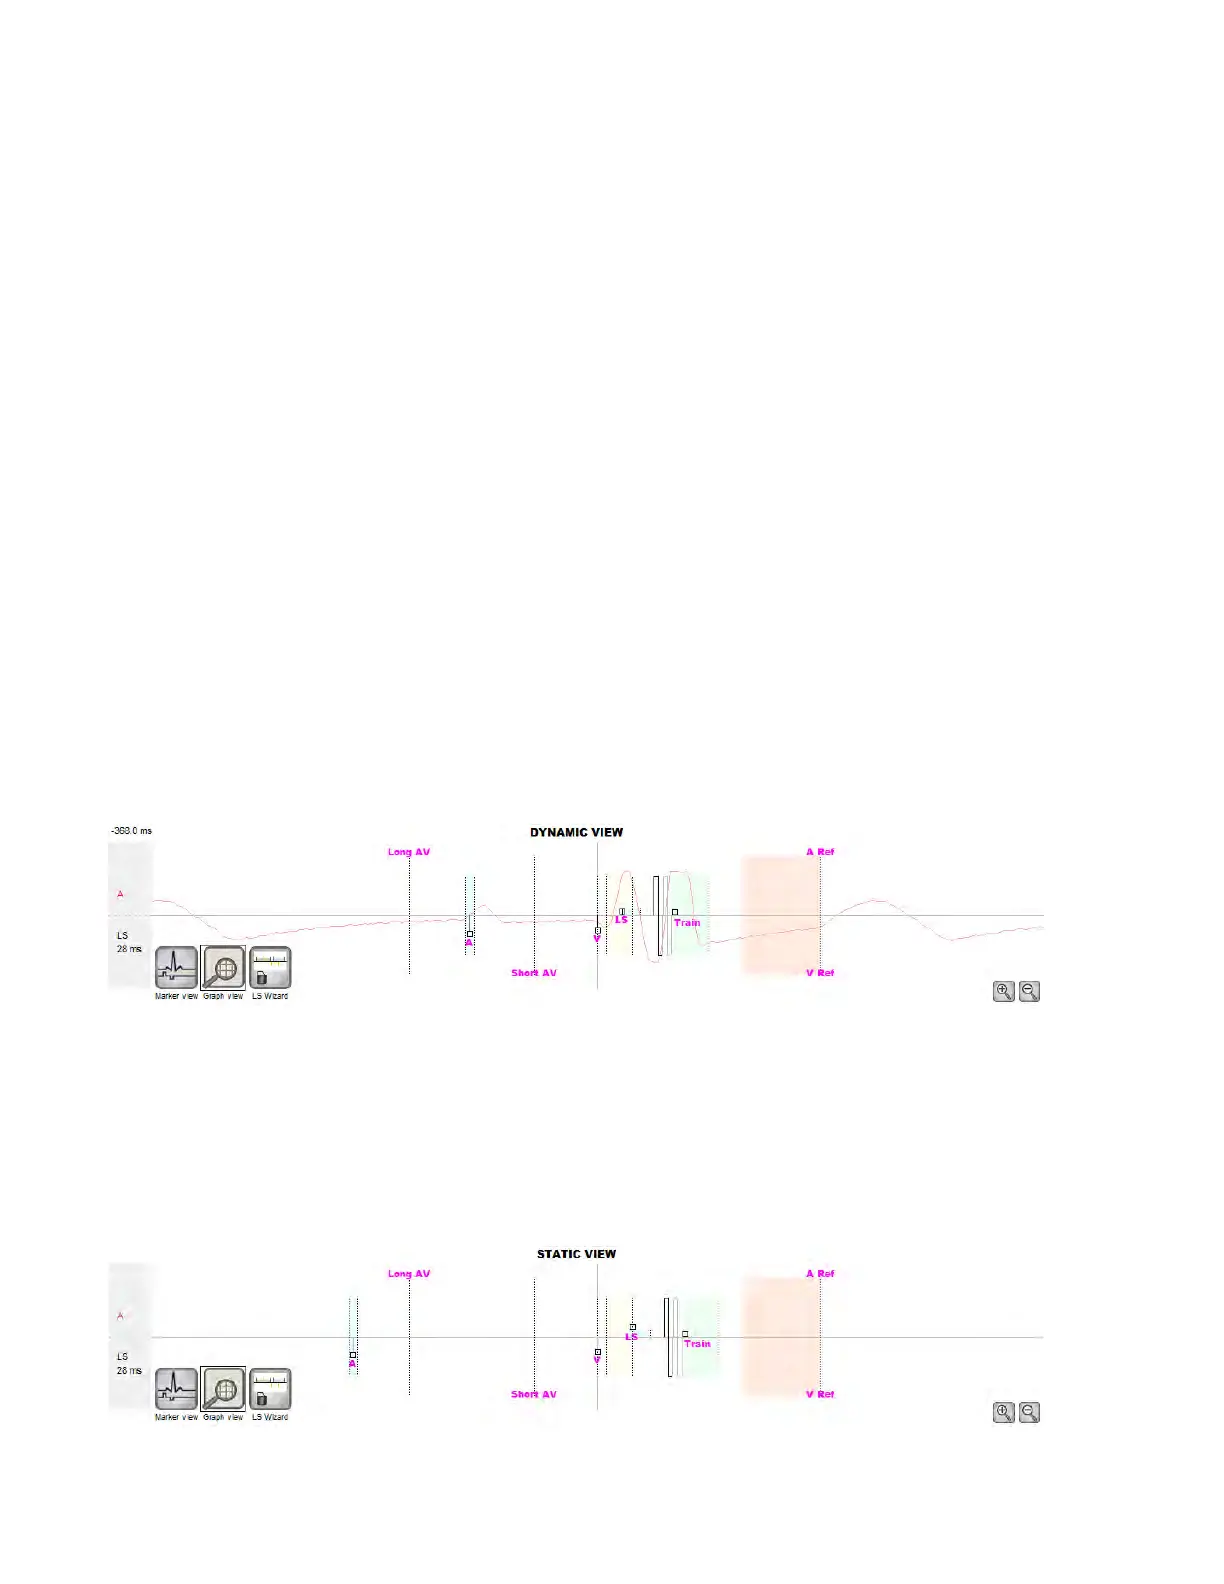
Figure 12: Graphic View (Dynamic)
12.3.2.2 Static View
In the Static View the ECG is not displayed, only the parameter values are
shown and can be modified. To modify a parameter value, drag it with the
cursor inside the graph to the desired position (the numeric value of the
parameter is shown as you point to it or move it). To have access to the list
of possible values for a parameter, select it with the cursor.
Figure 13: Graphic View (Static)