Left-clicking the keyboard mouse button or touching the screen with the
stylus causes the graph to zoom in. Right-clicking the keyboard mouse
button or touching the screen with the stylus’ button depressed causes the
graph to zoom out. A scrollbar appears in the bottom of the graph when it
is zoomed in.
Additionally, the position of the cursor with respect to the ventricular
event is indicated in the top left of the graph.
The black/blue/red (programmed, pending, conflict) color convention is
also used for the parameter values in the graphic view.
12.3.3 LS Wizard
In the LS Wizard the ECG is not displayed, only the LS parameter values are
shown and can be modified. To modify a parameter value, drag it with the cursor
inside the graph to the desired position (the numeric value of the parameter is
shown as you point to it or move it). To have access to the list of possible values
for a parameter, select it with the cursor.
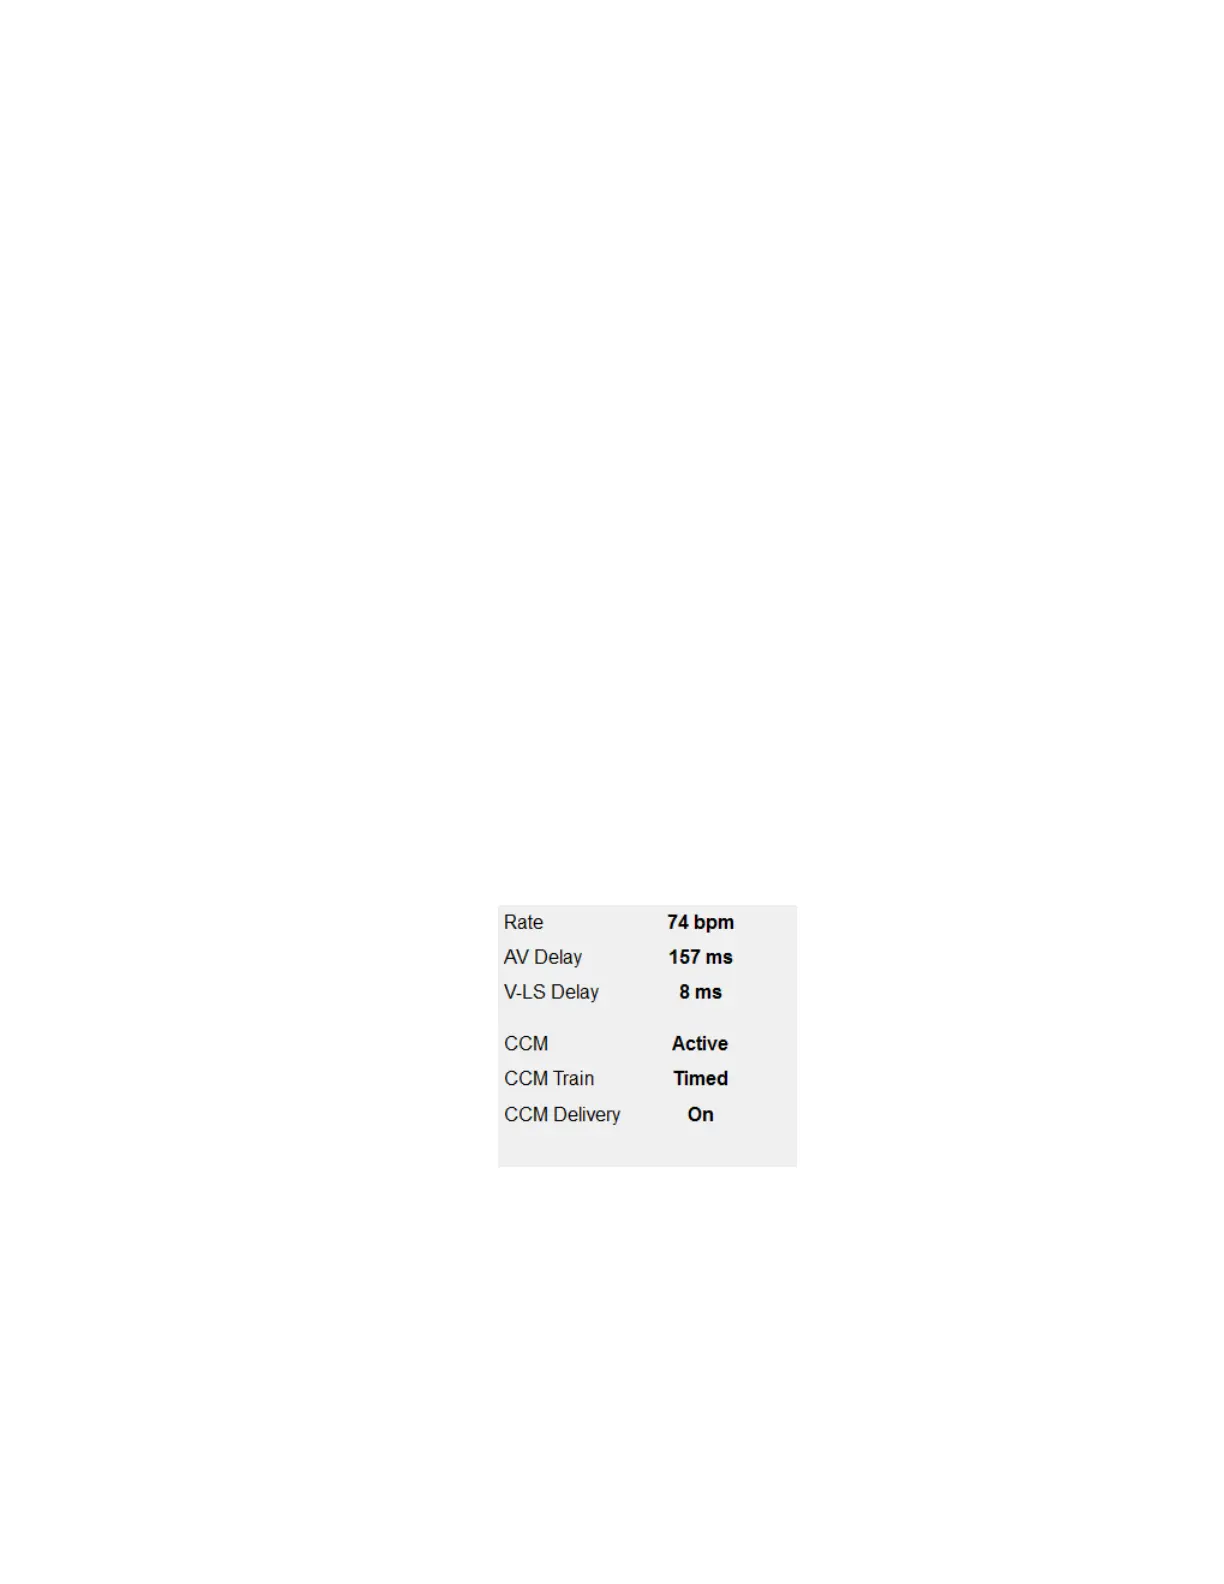
12.4 ECG Statistics Bar
The ECG Statistics Bar displays the following values:
• Rate: Heart rate in beats per minute (bpm)
• AV Delay: AV interval in milliseconds
• V-LS Delay: V-L interval in milliseconds
• CCM: CCM mode status
• CCM Train: CCM delivery mode
• CCM Delivery: CCM delivery status
Figure 14: ECG Statistics Bar
When the OPTIMIZER Smart IPG is in Marker Mode and within communications range
of the OMNI II Programmer Wand, the Period, AV Delay, and V-LS Delay intervals
change dynamically, showing the current reading for each value.