VIsualEyes 515/525 - Additional Information Page 31
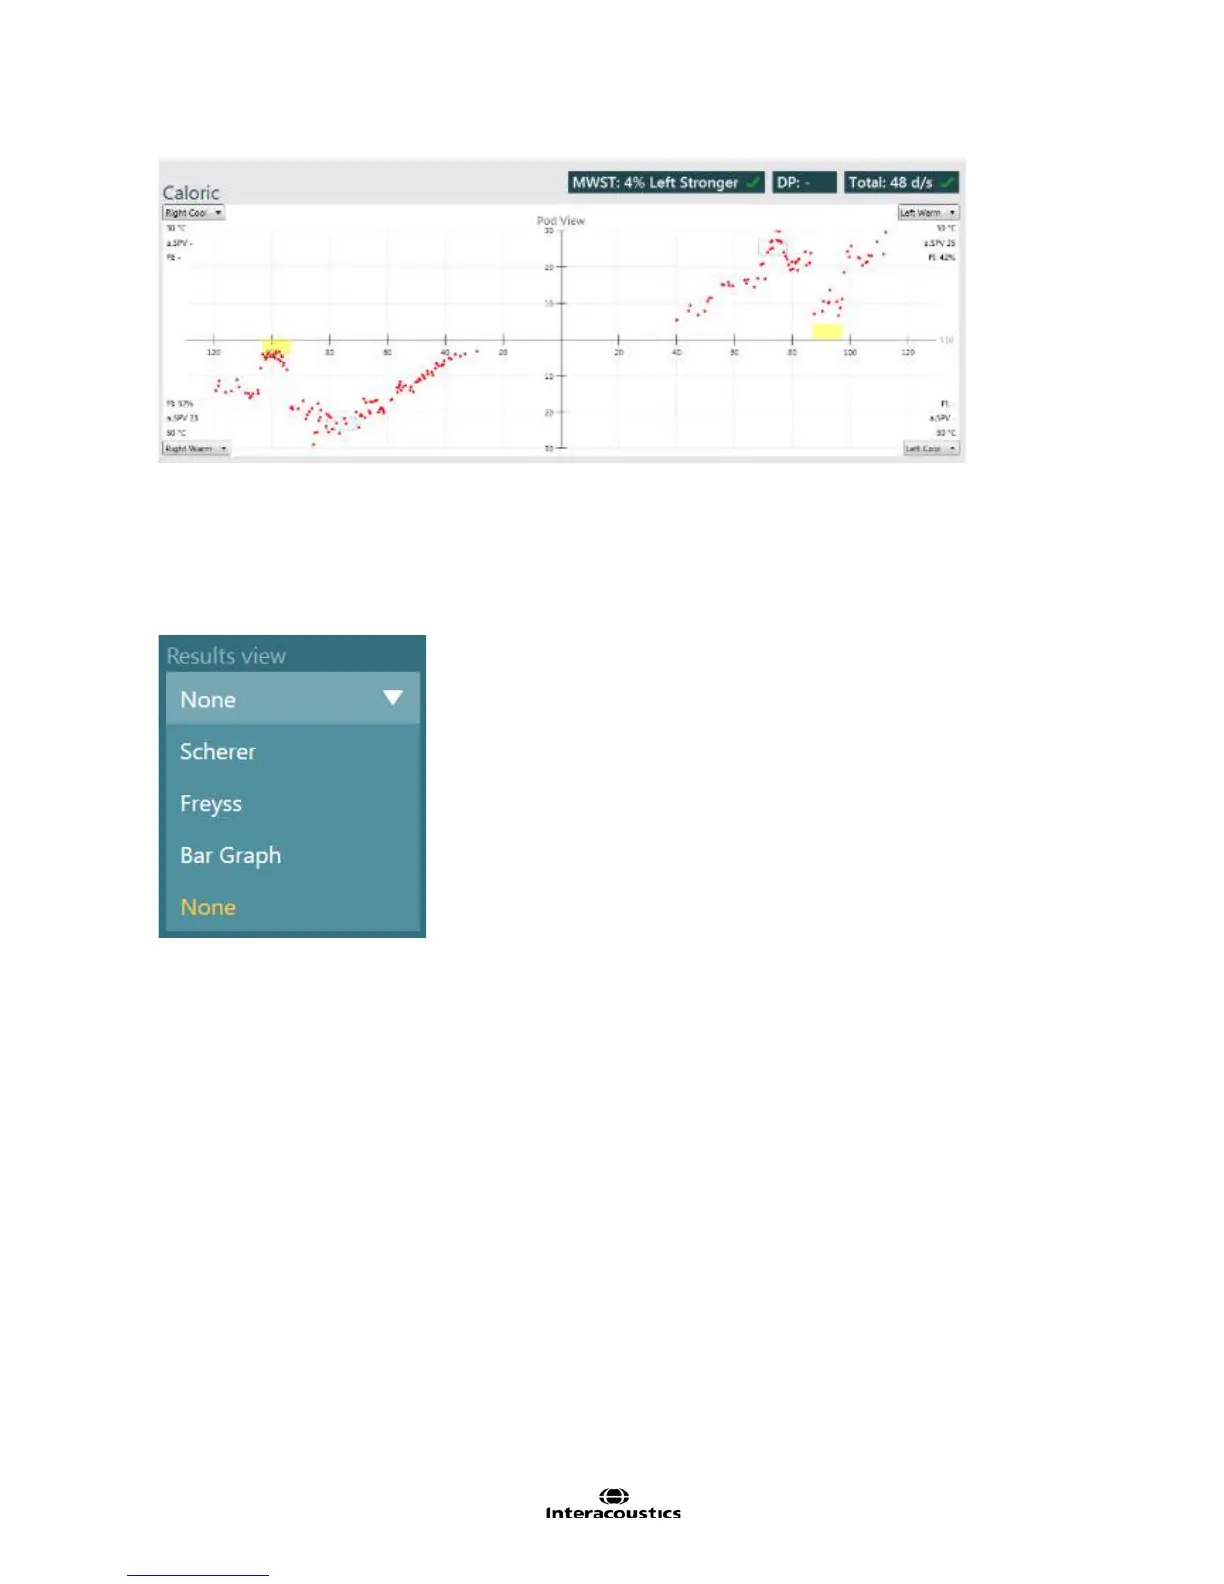
Figure 3.5.4 Caloric summary results for MWST
Caloric Results Views
The caloric results may be displayed in a number of different standard diagrams. In addition to the Pod View,
the caloric results can be displayed in the Bar graph and Freyss line graph. In certain regions the additional
options of Scherer, Claussen, and Haid-Stoll graphs are available. To select an additional view, use the
Results View selection box and choose the desired view.
Figure 3.5.5 Caloric Results View selection box
All diagrams are positioned in the upper portion of the review screen next to the pods diagram.
Pods
In the pod diagram, the slow phase velocity (SPV) of horizontal nystagmus beats are plotted over time.