VIsualEyes 515/525 - Additional Information Page 38
Phase > 0°
Eye movement leads the head movement
Gain
Gain measurement provides an indication of the responsiveness of the peripheral vestibular system. If the
function of the (VOR) is to produce an eye movement that compensates for head movement, then under
perfect conditions the slow phase eye velocity of the response to rotation should be a mirror image of head
velocity producing a gain of 60 %.
The gain is the relation between amplitude of the sine wave function (generated from the eye-movement
data) and the amplitude of the sine wave function fitted to the reclining chair data.
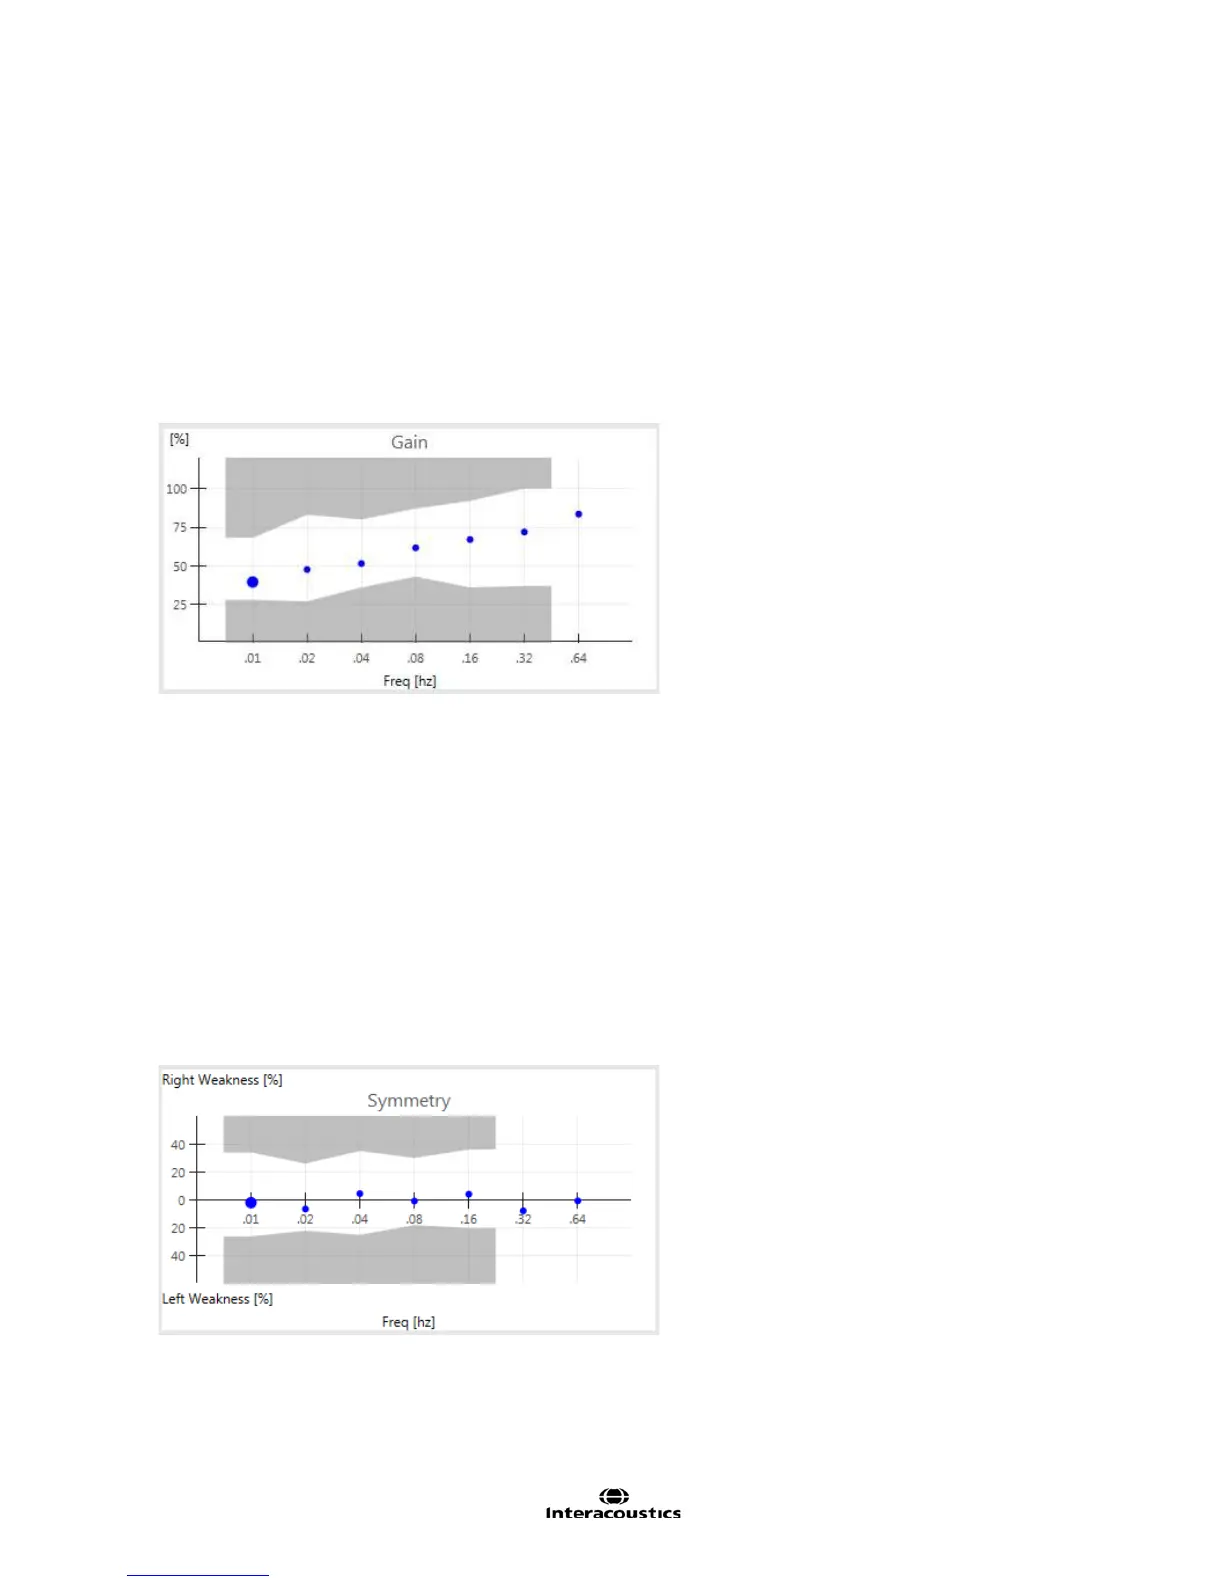
Figure 3.6.8 Gain graph
Gain values are expressed as a percentage (%). Values within the white region of the graph are considered
to be within suggested threshold levels and those in the grey shaded regions are considered to be outside of
the suggested threshold levels or criteria (Figure 3.6.8). When data points fall in the grey shaded regions, the
graph will be marked with a red diamond to indicate that the patient’s data was outside of the suggested
threshold level.
Symmetry
The Symmetry is measured as the difference between maximum left-beating and right-beating eye velocities
divided by the total of the left- and right-beating maximum slow phase eye velocities.
Values describing asymmetry of response are calculated by comparing slow-phase eye velocities with right-
moving rotation and left-moving rotation. Calculation is based on the average maximum slow phase velocity
for left and right cycles.
Figure 3.6.9 Symmetry graph