VIsualEyes 515/525 - Additional Information Page 39
Values displayed in the Symmetry Graph are provided as a percentage (%). Values within the white region of
the graph are considered to be within suggested threshold levels and those in the grey shaded regions are
considered to be outside of the suggested threshold levels or criteria (Figure 3.6.9). When data points fall in
the grey shaded regions, the graph will be marked with a red diamond to indicate that the patient’s data was
outside of the suggested threshold level.
Graph numerical values
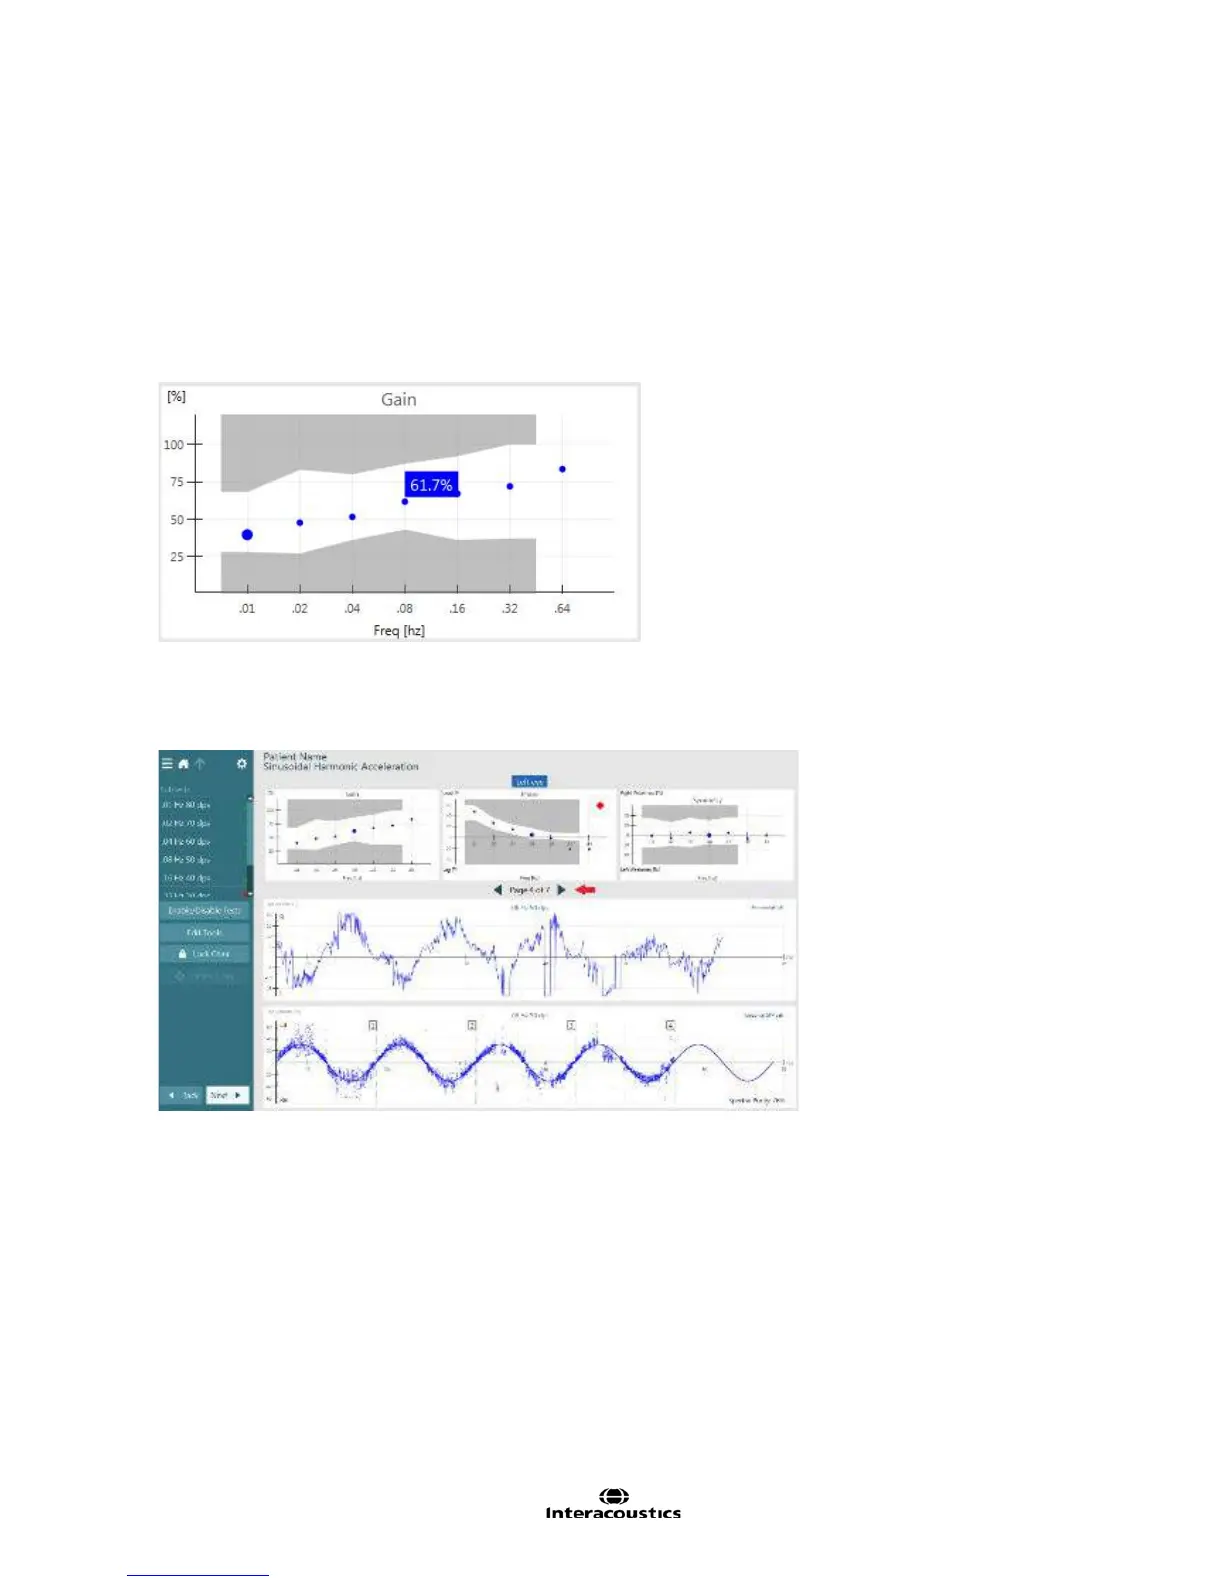
Exact numerical values can be obtained by tapping on or hovering over the individual data point within the
Gain, Phase, and Symmetry graphs (Figure 3.6.10).
Figure 3.6.10 Numerical value for specific data point
The largest data point represents the frequency (Hz) page that is currently being displayed. Tapping on a
smaller data point will then display the data for that frequency. Alternatively, tap the arrows next to the page
numbers to move to results for other frequencies (Figure 3.6.11).
Figure 3.6.11 Changing page numbers in Sinusoidal Harmonic Acceleration summary
Eye position display
In the middle portion of the summary results screen, the eye position (°) tracing is displayed. The eye
position tracing (Figure 3.6.12) represents eye movement during chair rotation and is displayed as a function
of eye position in degrees (y-axis) over time in seconds (x-axis).