VIsualEyes 515/525 - Additional Information Page 52
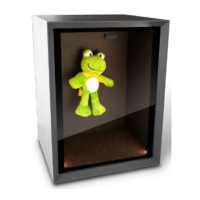
Figure 3.6.34 Gain graph with VOR and VOR Suppression tests
Gain reduction
The percent gain reduction result is obtained by comparing any given frequency of rotation with no visual
fixation to the gain result at the same frequency of rotation with visual fixation. Percent gain reduction is a
percentage by which the nystagmus has reduced as a result of fixating on a target. Among the normal
population, it is not uncommon to see % Gain Reduction of 50%.
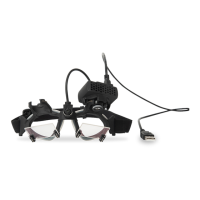
Figure 3.6.35 Gain reduction graph
The percent reduction results are plotted with triangles. Values are expressed as a percentage (%).
Graph numerical values
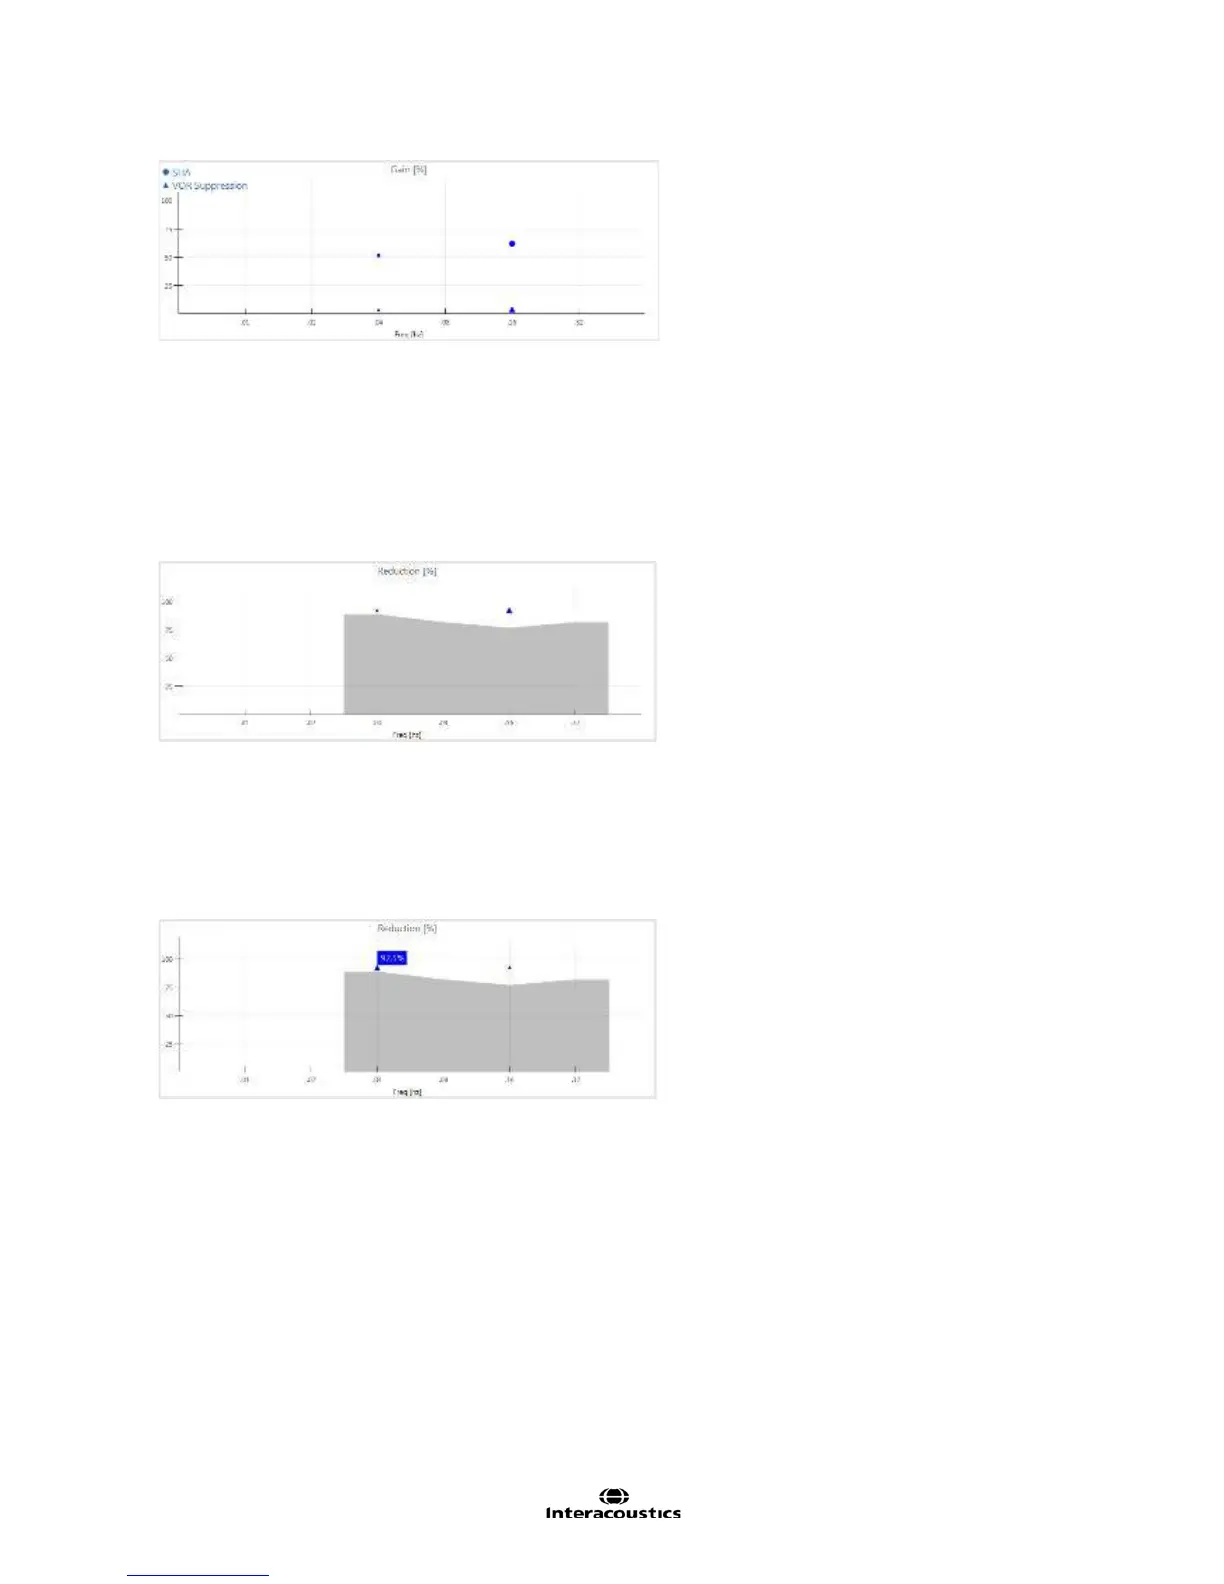
Exact numerical values can be obtained by tapping on or hovering over the individual data point within the
Gain and Reduction graphs (Figure 3.6.36).
Figure 3.6.36 Numerical value displayed
The largest data point represents the frequency (Hz) page that is currently being displayed. Tapping on a
smaller data point will then display the data for that frequency.