VIsualEyes 515/525 - Additional Information Page 51
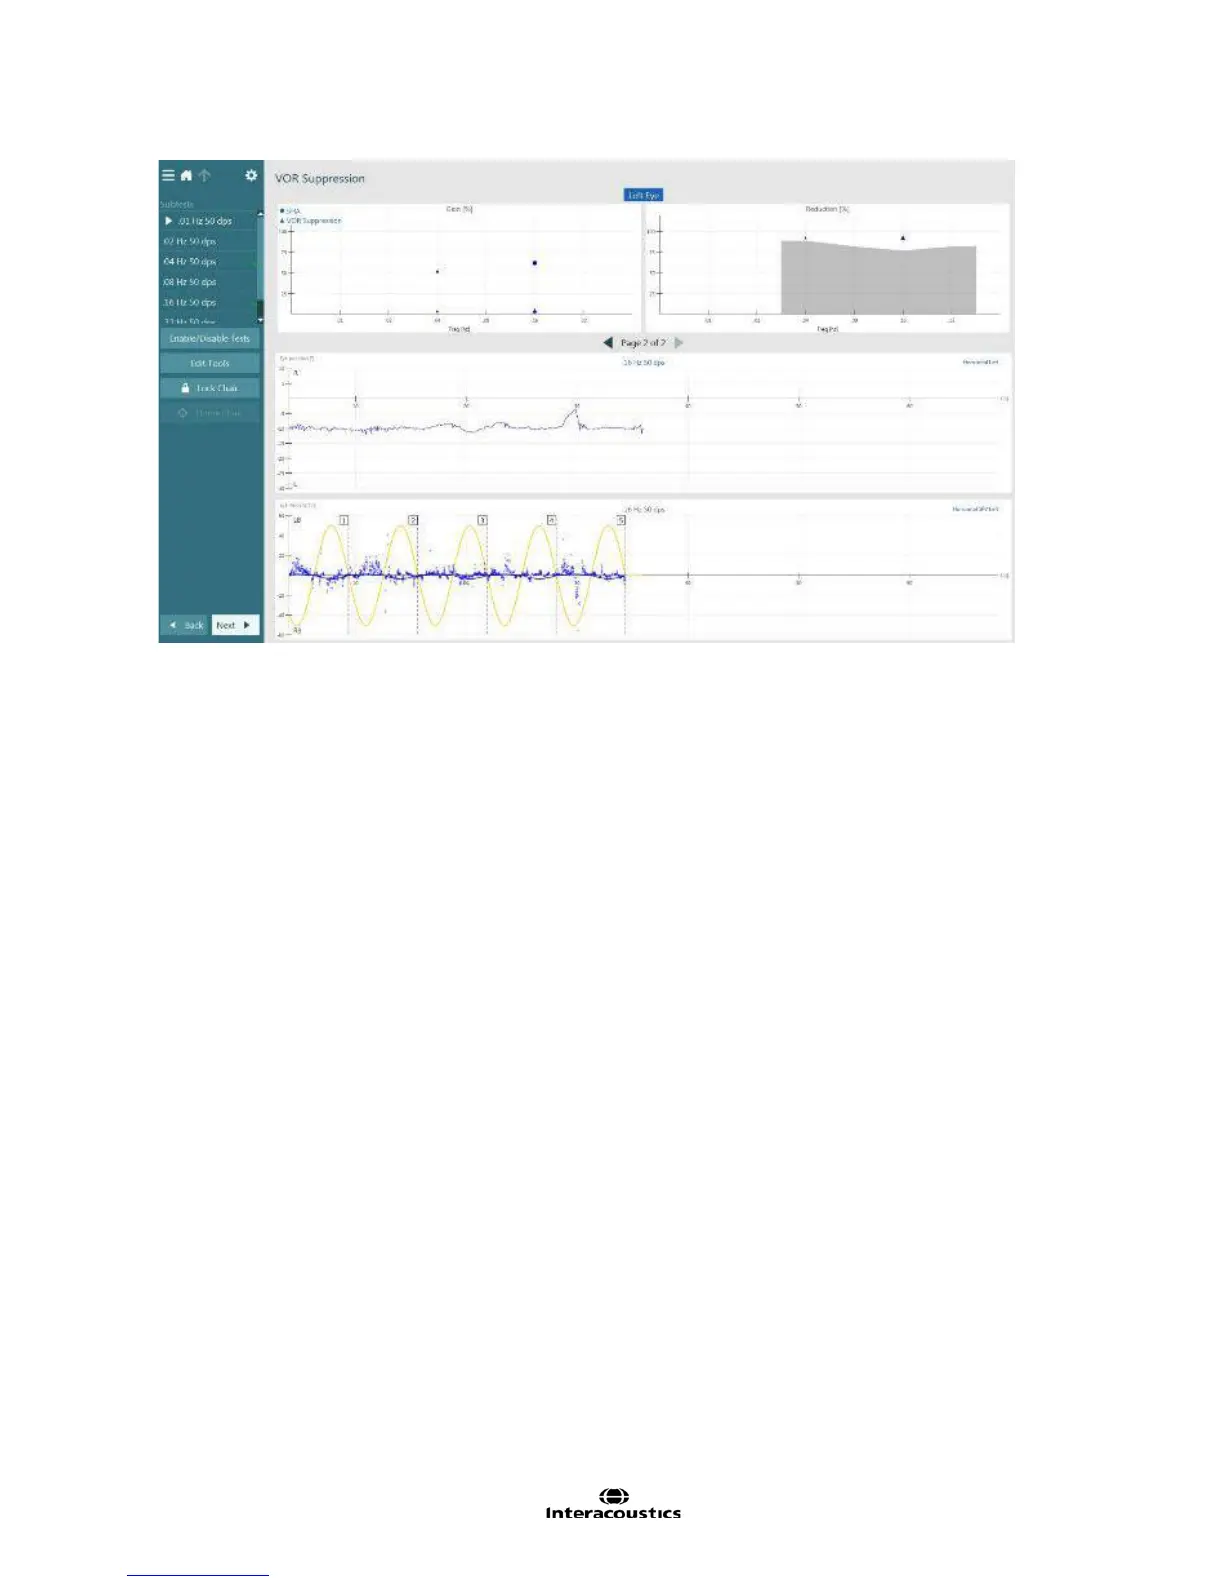
Figure 3.6.33 VOR suppression summary
A patient with normal VOR suppression results will produce a tracing that shows significantly reduced
nystagmus as the patient is rotated from left to right in the chair. The data points for each frequency tested
will appear as triangles in the Gain (%) and Reduction (%) graphs. The circular data points represent the
previously recorded SHA results.
Please note: The first half cycle (hatched region) of each frequency tested is excluded from analysis
for improved test reliability.
Analysis of eye movements is performed separately for the right and left eyes and the results are displayed
separately. Left eye results are displayed by default. The displayed results can be changed to the right eye
by selecting the eye title in the top center of the summary test results screen.
The summary test results screen displays various analyses. The top portion of the summary results screen
displays plots for Gain, Reduction. These parameters are explained in detail in the following section.
Gain
The software will automatically compare the patient’s gain during a VOR suppression test to the gain during
a Sinusoidal Harmonic Acceleration at the same frequency so that both can be plotted on the VOR
Suppression gain graph. Sinusoidal Harmonic acceleration results are plotted with circles and VOR
suppression results are plotted with triangles (Figure 3.6.34).
VOR Suppression gain is simply the raw value for the ratio of maximum slow phase nystagmus velocity to
head (chair) velocity. The lower the gain value, the better the patient was able to suppress his/her nystagmus
by fixating on a target during SHA rotation. An inability to sufficiently suppress the VOR is indicative of
possible central vestibular pathology.
Values are expressed as a percentage (%).