7.
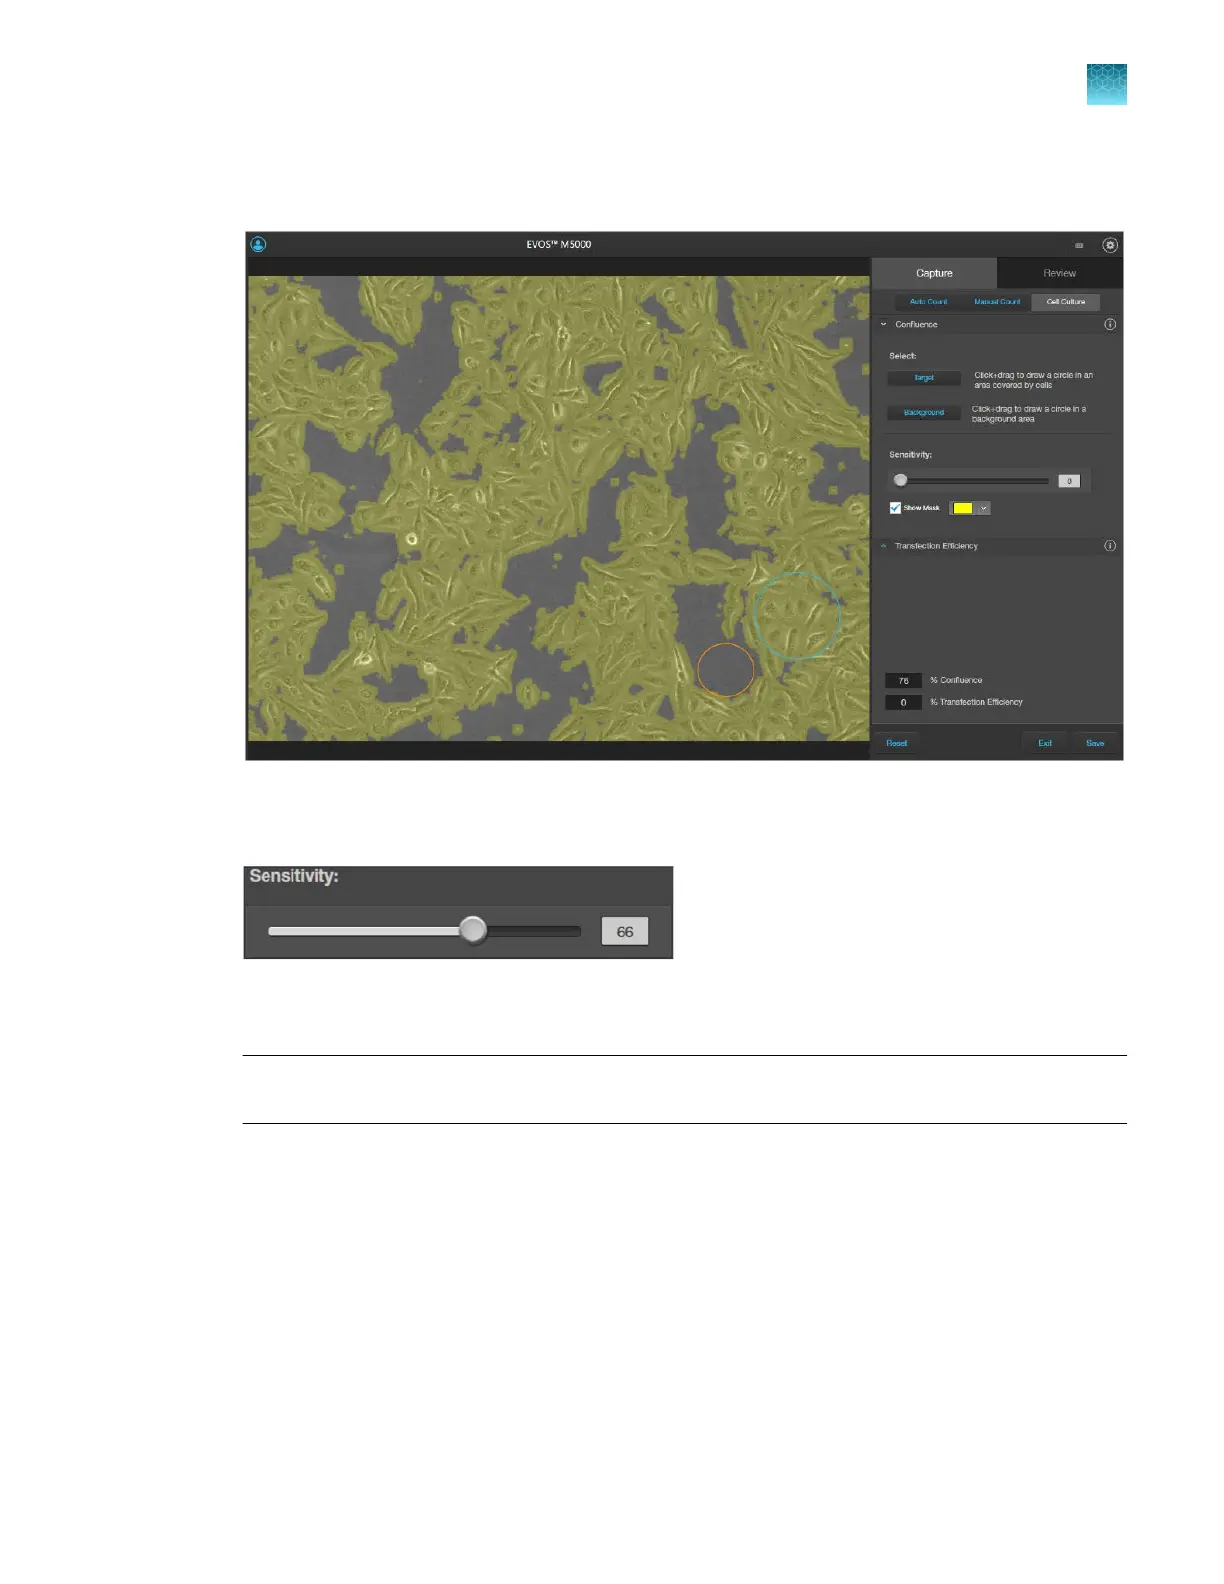
To view the areas of the image counted as Target, select Show Mask. The areas counted as Target
are highlighted in the selected color.
8.
Refine
the sensitivity of the Confluence measurement using the Sensitivity slider. Increased the
sensitivity results in higher confluence value.
The software automatically calculates the
confluence of your culture and displays the results as a
percentage of confluence.
Note:
As you adjust sensitivity, observe the image with the Show Mask option on. Ensure that the
tar
get areas are selected with minimal coverage of the background areas.
9.
When you complete the confluence measurement, the Transfection Eciency tool becomes
available. To calculate transfection eciency, go to “Calculate transfection eciency” on page58.
10.
To save your Confluence results without calculating transfection eciency, click Save (see “Save
analysis results” on page
92).
Chapter5Measure, annotate, and analyze captured images
Measure confluence
5
EVOS
™
M5000 Imaging System User Guide
57