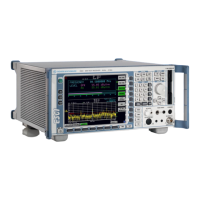
TRACE - Receiver R&S ESCI
1166.6004.12 4.62 E-2
Selection and Setting of Traces –TRACE Key
The R&S ESCI is capable of displaying up to three different traces at a time in a diagram. A trace
consists of a maximum of 501 pixels on the horizontal axis (frequency or time). If more measured values
than pixels are available, several measured values are combined in one pixel.
The traces are selected using the SELECT TRACE softkey in the menu of the TRACE key.
The traces can individually be activated for a measurement or frozen after completion of a
measurement. Traces that are not activated are blanked.
The display mode can be selected for each trace. Traces can be overwritten in each measurement
(CLEAR/WRITE mode), averaged over several measurements (AVERAGE mode), or a maximum or
minimum value can be determined from several measurements and displayed (MAX HOLD or MIN
HOLD).
Individual detectors can be selected for the various traces. The max peak detector and min peak
detector display the maximum and minimum value of the level within a pixel. The rms detector displays
the power (rms value) of the measured values within a pixel, the average detector the average value.
The quasi-peak detector yields the level weighted to CISPR 16.
Selection of Trace Function
The trace functions are subdivided as follows:
• Display mode of trace (CLEAR/WRITE, VIEW and BLANK)
• Evaluation of the trace as a whole (AVERAGE, MAX HOLD and MIN HOLD)
• Evaluation of individual pixels of a trace (MAX PEAK, MIN PEAK, QUASIPEAK, AVERAGE and
RMS).
TRACE menu
SELECT
TRACE
VIEW
CLEAR/
WRITE
BLANK
MAX HOLD
TRACE
DETECTOR
SCAN
COUNT
MIN HOLD
ASCII FILE
EXPORT
DECIM SEP
. ,
COPY
TRACE
QUASIPEAK
MAX PEAK
AVERAGE
RMS
MIN PEAK
PEAK LIST
ON OFF
FINAL
QUASIPEAK
FINAL
MAX PEAK
FINAL
AVERAGE
FINAL
RMS
FINAL
MIN PEAK
FINAL
CISPR AV

 Loading...