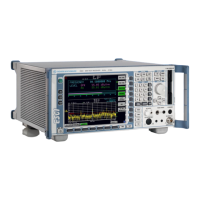
R&S ESCI Display
1166.6004.12 4.195 E-1
Configuration of Screen Display – DISP Key
The DISPLAY menu allows the configuration of the diagram display on the screen and also the selection
of the display elements and colors. The POWER SAVE mode is also configured in this menu for the
display.
The test results are displayed on the screen of the R&S ESCI either in a full-screen window or in two
overlapping windows. The two windows are called diagram A and diagram B.
In the default setting, the two windows are completely decoupled from each other, ie they behave like
two separate instruments. This is very useful, for example with harmonics measurements or
measurements on frequency-converting DUTs, since the input signal and the output signal lie in different
frequency ranges.
However, specific settings of the two windows (reference level, center frequency) can be coupled, if
required, so that with CENTER B = MARKER A for example, the shift of the marker in diagram A causes
the frequency range (zoomed in some cases) to be shifted along diagram B.
In the default setting, the upper half of the screen shows the bar graph measurement of the receiver
(screen A) and the lower half shows the sweep of the spectrum analyzer (screen B). Various instrument
settings such as RF attenuation are coupled together for the two measurement screens, i.e. changing a
setting in one of the measurement screens automatically changes it in the other screen. You can define
which instrument settings are to be coupled from the PARAM COUPLING menu.
New setttings are performed in the diagram selected via hotkey SCREEN A or SCREEN B. If only one
window is displayed, it is the diagram in which the measurements are performed; the diagram not
displayed is not active for measurements.
Fig. 4-21 Typical split-screen display, settings are uncoupled

 Loading...