CDHD Tuning
User Manual 203
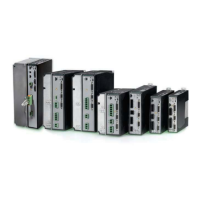
Figur e 9 - 1 3 . Autotuning – Modifie d Para m e t er s
Click N e x t to continue.
Step 6 – Test
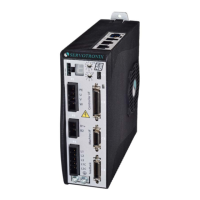
Figur e 9 - 1 4 . Autotuning – Test
1 . Press Move and Plot to send a current command to the drive and plot the
response.
Move and Plot enables the drive and m oves the mot or!
The resulting graph shows the position com m and profile in velocity units
(PTPVCMD), and the posit ion error (PE). Optionally, it can also display the
velocity of the mot or m easured by the feedback device (V) and/ or t he
current com m and (I CMD) .
The wizard also displays the Set t ling Tim e and the Position Err or
W in dow values calculat ed by the system .
N ote: The velocity and the position error graphs are scaled so that both fit
int o the fram e. The Y-axis is m arked in units of position error (counts) .
2 . I f necessary, adjust the global gain param eter (KNLUSERGAI N):
A higher gain value produces a stiffer response
 Loading...