Startdrive commissioning tool
2.5 User interface - trace function
Commissioning with Startdrive
46 Commissioning Manual, 11/2017, 6SL3097-4AA10-0BP1
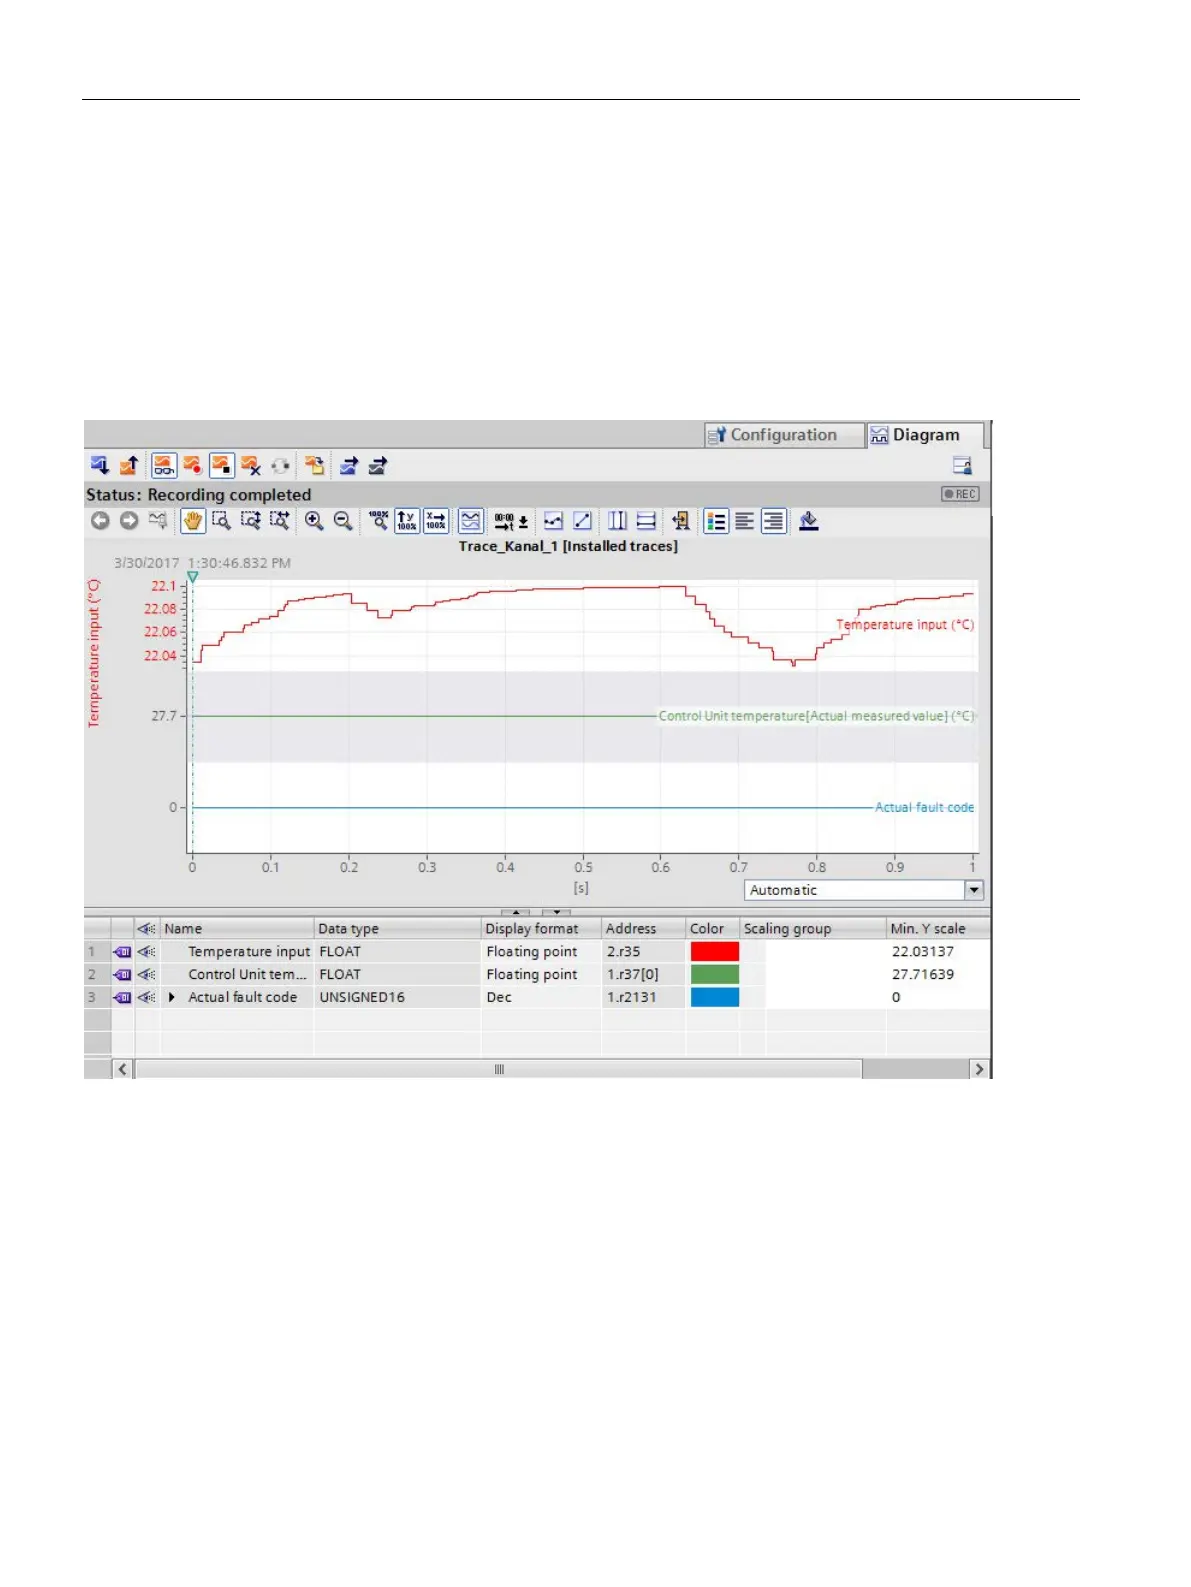
The curve diagram displays the selected signals of a recording. Binary signals are shown in
the lower diagram as bit track. You can adapt the display of the signals in the signal table
and with the toolbar of the curve diagram.
Setting options and displays in the curve diagram
The following figure shows the display in Startdrive as example:
Figure 2-12 Overview of ChartView
 Loading...