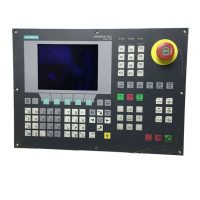
Figure 7-13 Example - PolylineMode: To
setIntegralFillMode – fills the areas between points, lines and arcs and the X axis
Syntax: ReturnValue = CallCWMethod
(GraphVarName, "
setIntegralFillMode
", SetIntFill)
Description: Areas between points, lines and arcs of the X axis are filled with the current fill
color (independent of whether the points are +Y or –Y).
This function is contour-specific, and can be activated and deactivated on a seg‐
ment-for-segment basis.
Parameters: GraphVarName Name of the display variable which contains a SlEs‐
GraphCustomWidget
Return Value Error code (bool): TRUE = successful
SetIntFill IntegralFillMode (bool): TRUE = on
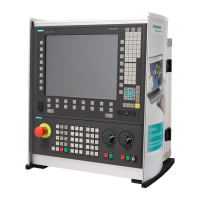
Example
Figure 7-14 Example - setIntegralFillMode: on
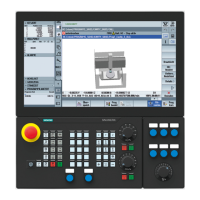
Figure 7-15 Example - setIntegralFillMode: Off
repaint, update – update view
Syntax: ReturnValue = CallCWMethod
(GraphVarName, "
repaint
")
ReturnValue = CallCWMethod
(GraphVarName, "
update
")
Description: Using this function, you can manually refresh the display.
Graphic and logic elements
7.5 SIEsGraphCustomWidget
SINUMERIK Integrate Run MyScreens (BE2)
Programming Manual, 12/2017, 6FC5397-1DP40-6BA1 237
 Loading...