3. Position "(A)" at the position on the curve where you wish to start the
measurement.
The coordinates are specified in a tooltip and in the status line.
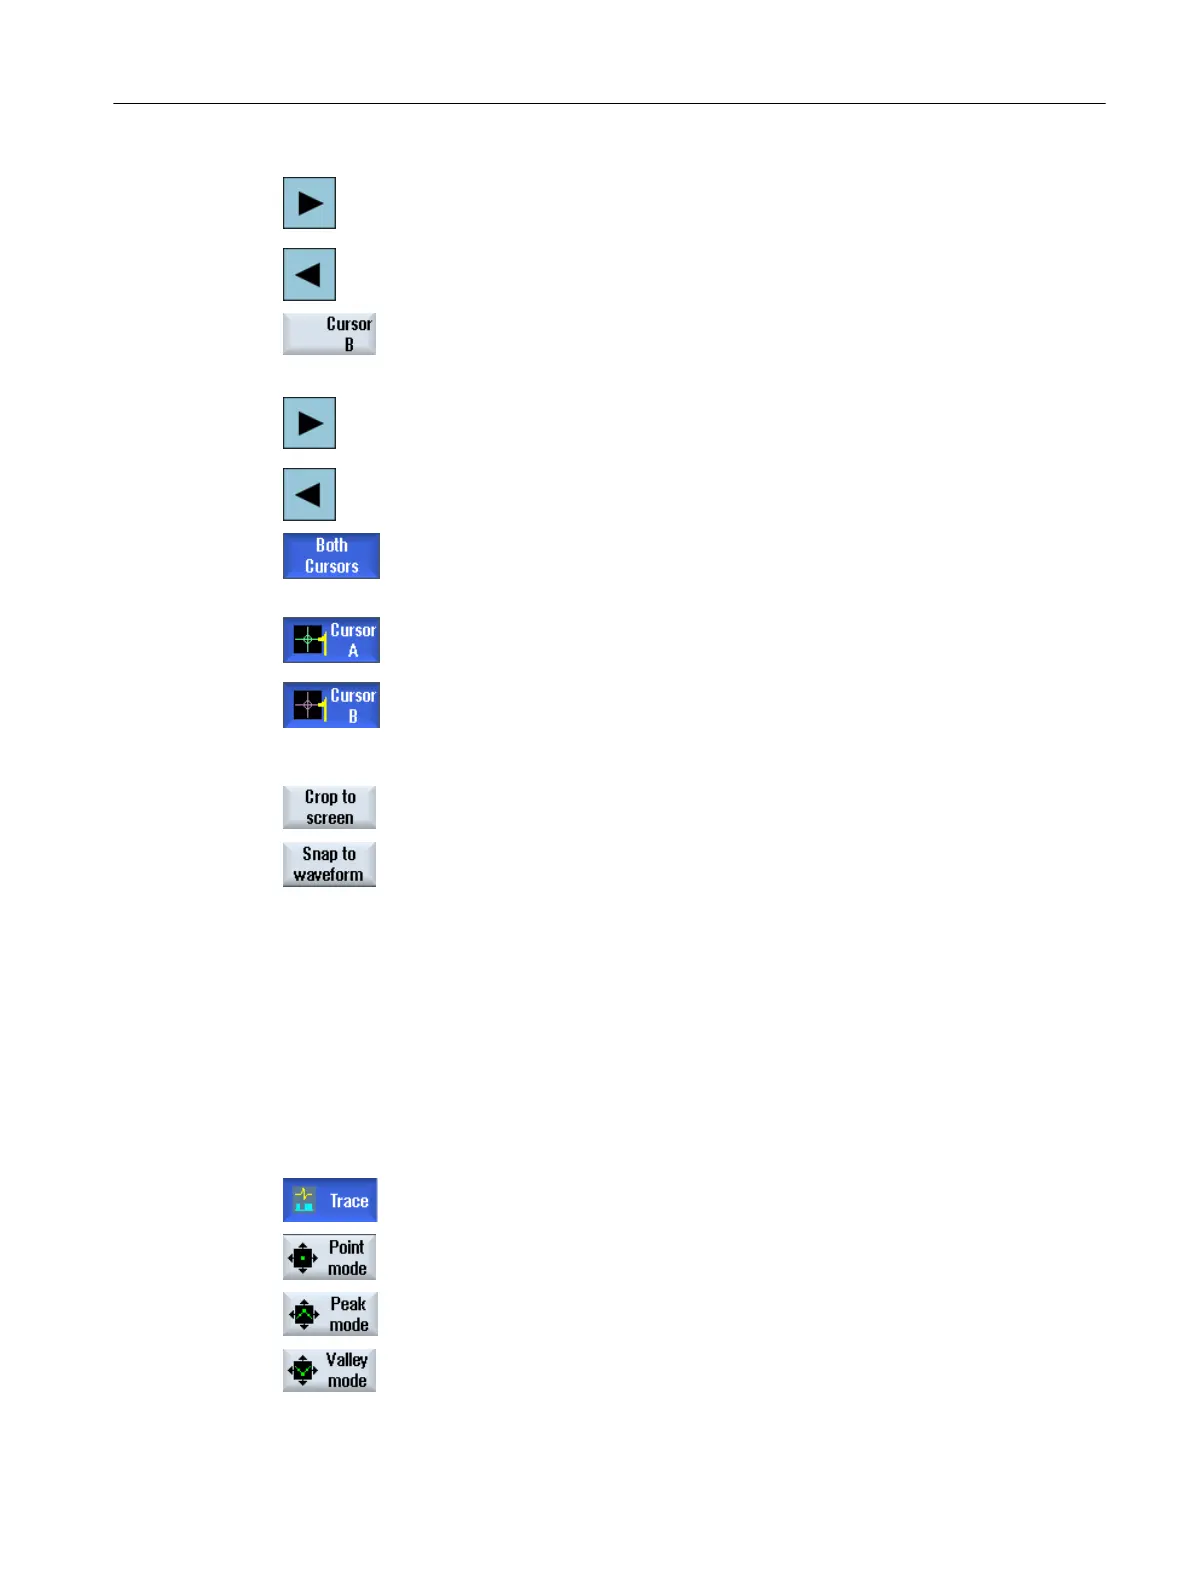
4. Press the "Cursor B" softkey.
The reference number, color of the variables as well as the color of the
coordinate crossing point are also displayed on this softkey.
Position "(B)" at the position on the curve where you wish to end the
measurement.
5. Press the "Both cursors" softkey to display the area between A and B.
The coordinates of A and B as well as the difference "Δ" are displayed in
the status line.
Press the active "Cursor A" and "Cursor B" softkeys again to deselect the
position.
When re-selected, the positions are reset.
Press the "Crop to screen" softkey to display the area, defined by "Cursor
A" and "Cursor B", in the complete graphic window.
Press the "Snap to waveform" softkey to move the cursor along the curve
step-by-step.
18.12.5.6 Acquiring measured values
You have the option of directly determining the following values of a curve:
● Peak-to-peak value
● Peak-to-valley value
Procedure
A recording is opened in the "Trace" graphics window.
Press the "Point Mode" softkey to continuously move the cursor along the
curve.
Press the "Peak Mode" softkey to position the cursor at the highest value.
Press the "Valley Mode" softkey to position the cursor at the lowest value.
Service and diagnostics
18.12 Trace
SINUMERIK Operate (IM9)
Commissioning Manual, 12/2017, 6FC5397-1DP40-6BA1 475
 Loading...