EasyManuals Logo
Home>Texas Instruments>Calculator>TI-84 Plus

Texas Instruments TI-84 Plus Guide Book

Texas Instruments TI-84 Plus
696 pages
To Next Page IconTo Next Page
To Previous Page IconTo Previous Page
Page #284 background imageLoading...
Page #284 background image
Chapter 12: Statistics 281
The new residual plot shows that the residuals are random in sign, with the residuals
increasing in magnitude as the string length increases.
To see the magnitudes of the residuals, continue with these steps.
Now that you have a good model for the relationship between length and period, you can
use the model to predict the period for a given string length. To predict the periods for a
pendulum with string lengths of 20 cm and 50 cm, continue with these steps.
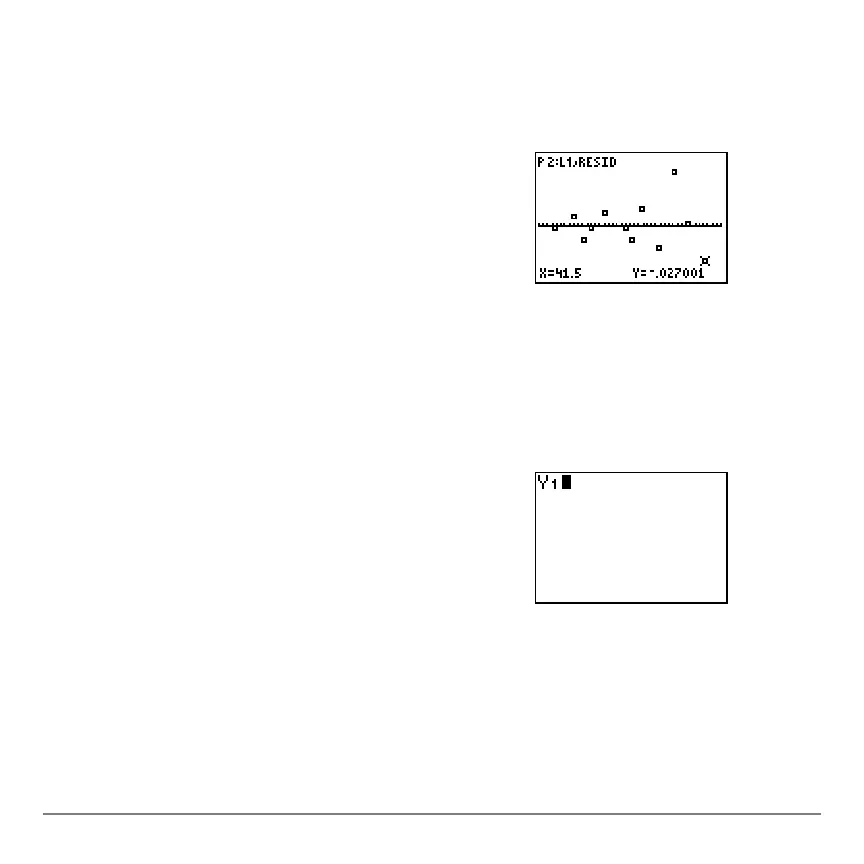
29. Press r.
Press ~ and | to trace the data. Observe the
values for Y at each point.
With this model, the largest positive residual is
about 0.041 and the smallest negative residual is
about L0.027. All other residuals are less than 0.02
in magnitude.
30. Press  ~
1 to display the VARS Y-VARS
FUNCTION
secondary menu, and then press 1 to
select
1:Y1. Y1 is pasted to the home screen.

Table of Contents

Other manuals for Texas Instruments TI-84 Plus

Questions and Answers:

Question and Answer IconNeed help?

Do you have a question about the Texas Instruments TI-84 Plus and is the answer not in the manual?

Texas Instruments TI-84 Plus Specifications

General IconGeneral
Battery typeAAA
Power sourceBattery
Number of batteries supported4
TypeGraphing
CoverNo
Form factorPocket
Control typeButtons
Product colorBlack
USB portYes
USB 2.0 ports quantity1
Digits- digits
Display number of lines8 lines
Display number of characters16
RAM capacity0.024 MB
ROM capacity0.480 MB
Storage media type-

Related product manuals