EasyManuals Logo
Home>Texas Instruments>Calculator>TI-84 Plus

Texas Instruments TI-84 Plus Guide Book

Texas Instruments TI-84 Plus
696 pages
To Next Page IconTo Next Page
To Previous Page IconTo Previous Page
Page #283 background imageLoading...
Page #283 background image
Chapter 12: Statistics 280
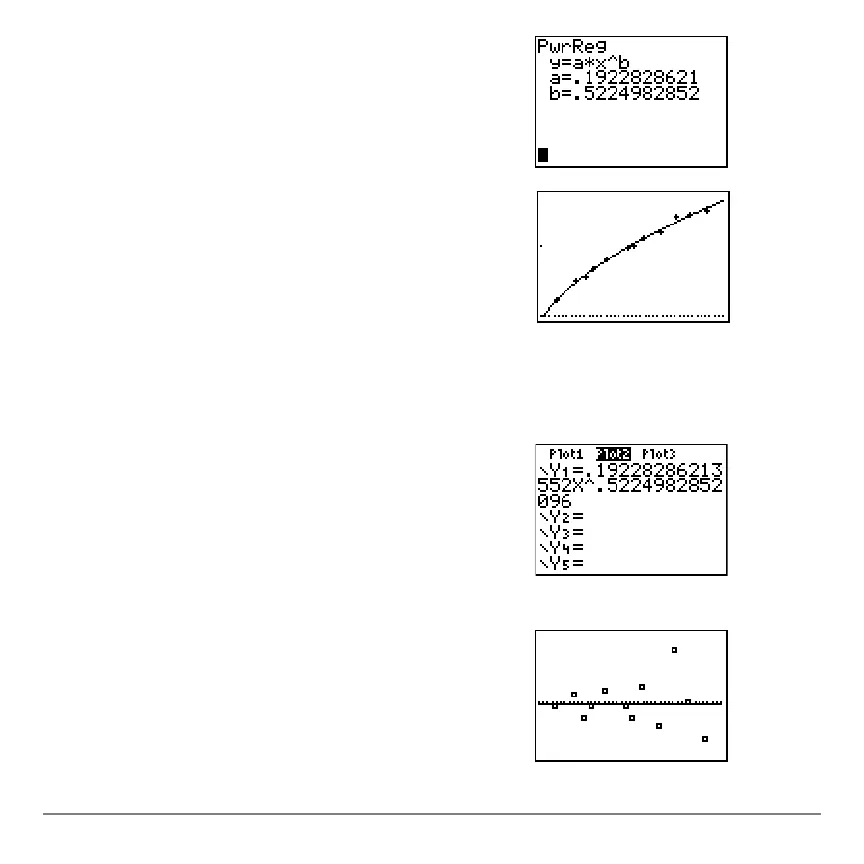
The new function y=.192x
.522
appears to fit the data well. To get more information,
examine a residual plot.
25. Press Í to calculate the power regression.
Values for
a and b are displayed on the home
screen. The power regression equation is stored
in
Y1. Residuals are calculated and stored
automatically in the list name
RESID.
26. Press s. The regression line and the scatter
plot are displayed.
27. Press o to display the Y= editor.
Press | Í to deselect
Y1.
Press } Í to turn off plot 1. Press to
turn on plot 2.
Note: Step 19 defined plot 2 to plot residuals
(
RESID) versus string length (L1).
28. Press q
9 to select 9:ZoomStat from the ZOOM
menu. The window variables are adjusted
automatically, and plot 2 is displayed. This is a
scatter plot of the residuals.

Table of Contents

Other manuals for Texas Instruments TI-84 Plus

Questions and Answers:

Question and Answer IconNeed help?

Do you have a question about the Texas Instruments TI-84 Plus and is the answer not in the manual?

Texas Instruments TI-84 Plus Specifications

General IconGeneral
Battery typeAAA
Power sourceBattery
Number of batteries supported4
TypeGraphing
CoverNo
Form factorPocket
Control typeButtons
Product colorBlack
USB portYes
USB 2.0 ports quantity1
Digits- digits
Display number of lines8 lines
Display number of characters16
RAM capacity0.024 MB
ROM capacity0.480 MB
Storage media type-

Related product manuals