89
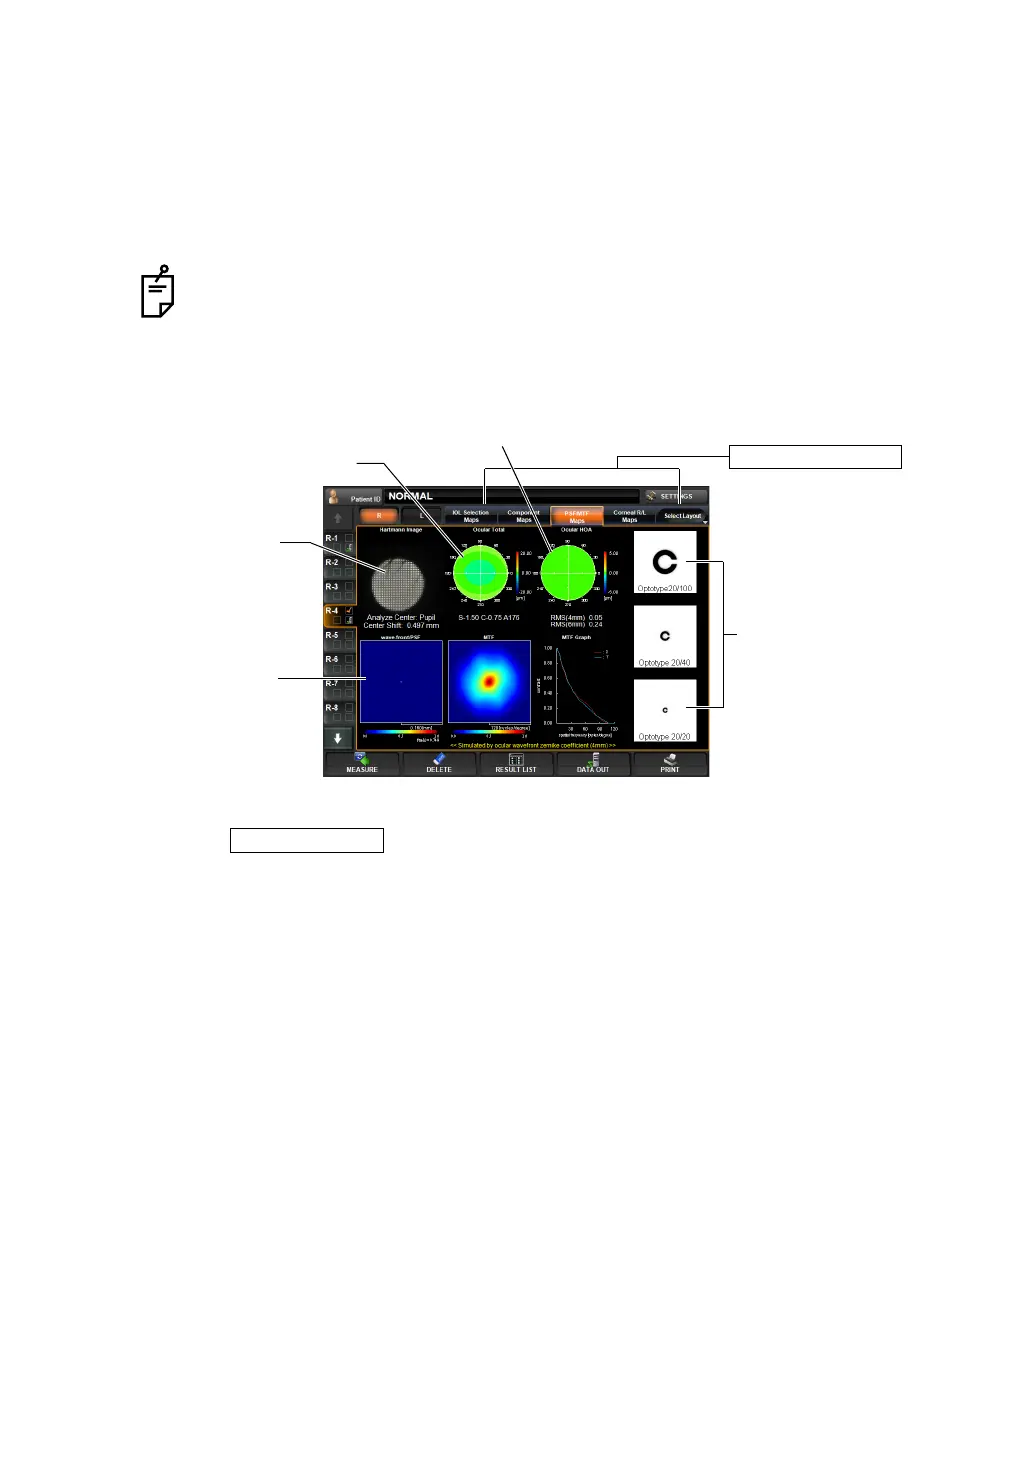
DISPLAYING THE MEASUREMENT RESULT
(11) Display of corneal astigmatic power
The value of corneal astigmatic power may be used as information
for making a decision in applying a bifocal IOL. The operation image
can be enlarged.
PSF/MTF MAP
The PSF/MTF map can be displayed.
To change display: Tap the Select Layout button (at the rightmost of Layout Change buttons),
and tap the
button from the pull down menu.
To change display to another map: Tap the Layout Change.
(1) Hartmann image (See "Hartmann Image" on page 79.)
(2) Ocular total aberration map
(See "Ocular Total Aberration Map" on page 80.)
Operation: • When tapped, the image is enlarged. (See "ENLARGEMENT DIS-
PLAY" on page 94.)
The Character color of measurement values of (8) to (11) can be changed when
the measurement result exceeds the set threshold value.
Refer to page 101 for concept of threshold and how to set threshold value.
Operation: • When tapped, the image is enlarged. (See "ENLARGEMENT DIS-
PLAY" on page 94.)
• When dragged in the right-left direction, the overlay can be
changed. (See page
98.)
Operation: • When tapped, the image is enlarged. (See "ENLARGEMENT DIS-
PLAY" on page 94.)
• The map display step can be changed. (See "SETTING THE
TOTAL ABERRATION MAP DISPLAY STEP (TOTAL ABERRA-
TION MAP RANGE)" on page 146.)
Layout Change button
(1) Hartmann image
(4) Wave-front/PSF
image, MTF image
and graph
(5) Simulation
(2) Ocular total aberration map
(3) Ocular HOA map