90
DISPLAYING THE MEASUREMENT RESULT
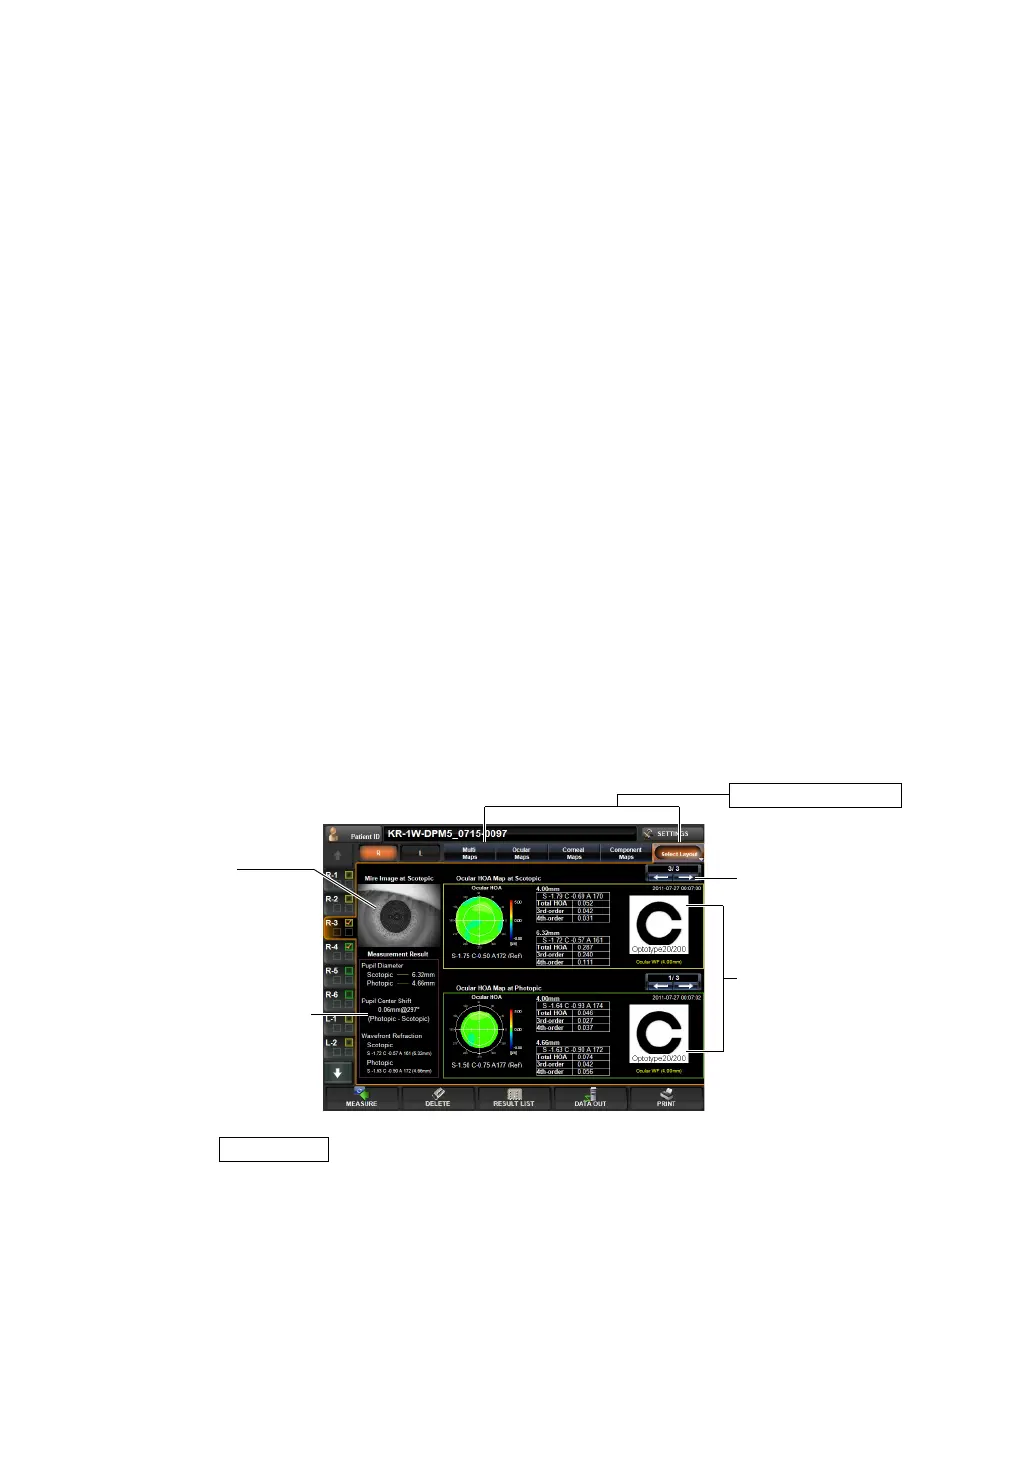
(3) Ocular HOA map (See "Ocular High Order Aberration Map" on page 80.)
(4) Wave-front/PSF image, MTF image and graph
Image formation of light on the retina is displayed. (See "Reference:
PSF, MTF" on page
110.)
(5) Simulation (See "Simulation" on page 82.)
PUPILLOMETRY MAP
Data of measurement by the Pupillometry mode can be confirmed.
Pupillometry map can be selected under pupillometry mode measuring only.
When the button is tapped after finishing the pupil measurement on the Pupil-
lometry screen, the Pupillometry map is displayed.
When the Pupillometry screen is selected, of the data measured by Scotopic, data with the
largest change in pupil diameter are selected and displayed.
To change the display to other maps: Tap the Layout change button.
Operation: • When tapped, the image is enlarged. (See "ENLARGEMENT DIS-
PLAY" on page 94.)
• The map display step can be changed. (See "SETTING THE HIGH
ORDER ABERRATION ASTIGMA MAP DISPLAY STEP" on page
147.)
Operation: • When tapped, the image is enlarged. (See "ENLARGEMENT DIS-
PLAY" on page 94.)
Operation: • When tapped, the image is enlarged. (See "ENLARGEMENT DIS-
PLAY" on page 94.)
• The orientation of the optotypes can be changed.
(See "SETTING OPTOTYPE DIRECTION" on page 152.)
• The vision of each chart can be changed. (See "SETTING OPTO-
TYPE SIMULATION 1 (UPPER)" on page 151.)
• To normalize the brightness or not can be changed. (See "SET-
TING THE NORMALIZATION OF BRIGHTNESS OF SIMULATION
(NORMALIZE DESTINY OF SIMULATIONS)" on page 152.)
Layout Change button
(1) Mire Image
(2) Difference information
(3) RMS (4mm/pupil diam-
eter), Simulation (pupil
diameter, 4th-order)
(4) Data Feed button