21
Trend gragh for the previous 120 hour can be diplayed in the resolution of one data per minute,
per five minutes or per ten minutes.
Users can select the TREND Diagram Review item under the System menu so as to pop up the
following window:
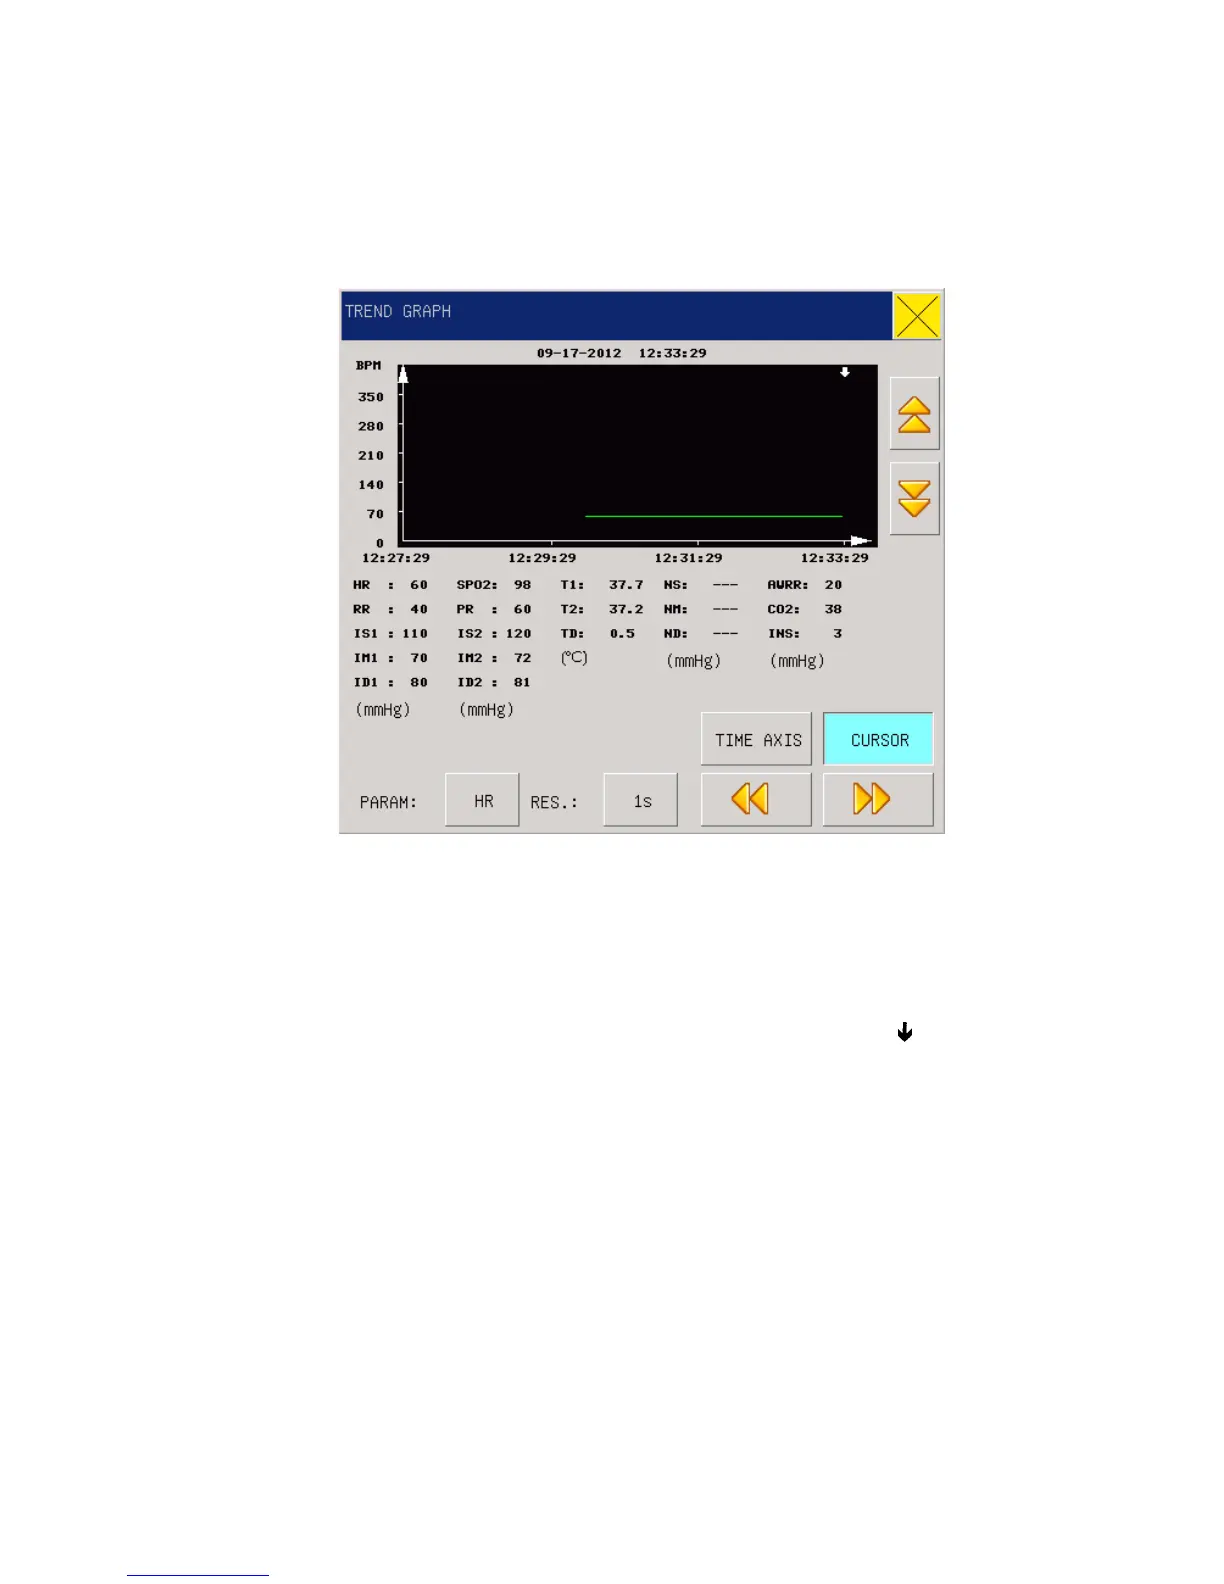
Fig 3-7 Trend Graph
Parameter selection: HR、RR、SPO2、PR、TEMP、NIBP、IBP1、IBP2、CO2、INS、AWRR.Y-axis
means measurement value, X-axis means measurement time. “Д is cursor for trend graph, The
measurement values it points to display at the bottome of the graph, corresponding time at the
upper end of the graph: 2012-09-17 12:33:29。
Vertical axis is for measured values and horizontal axis for measurement time. The “
” symbol is
the cursor for TREND diagrams, and the measured value at the position it arrows is displayed
below the TREND diagram while its corresponding time is displayed above the TREND diagram.
3.7 TREND TABLE (TREND Figure)
TREND Figure data over the previous 120 hours can be displayed in the following resolutions: 1
minute, 5 minutes, 10 minutes, 30 minutes and 60 minutes.
Select “TREND TABLE” under the system menu to pop up the following TREND Figure: