22
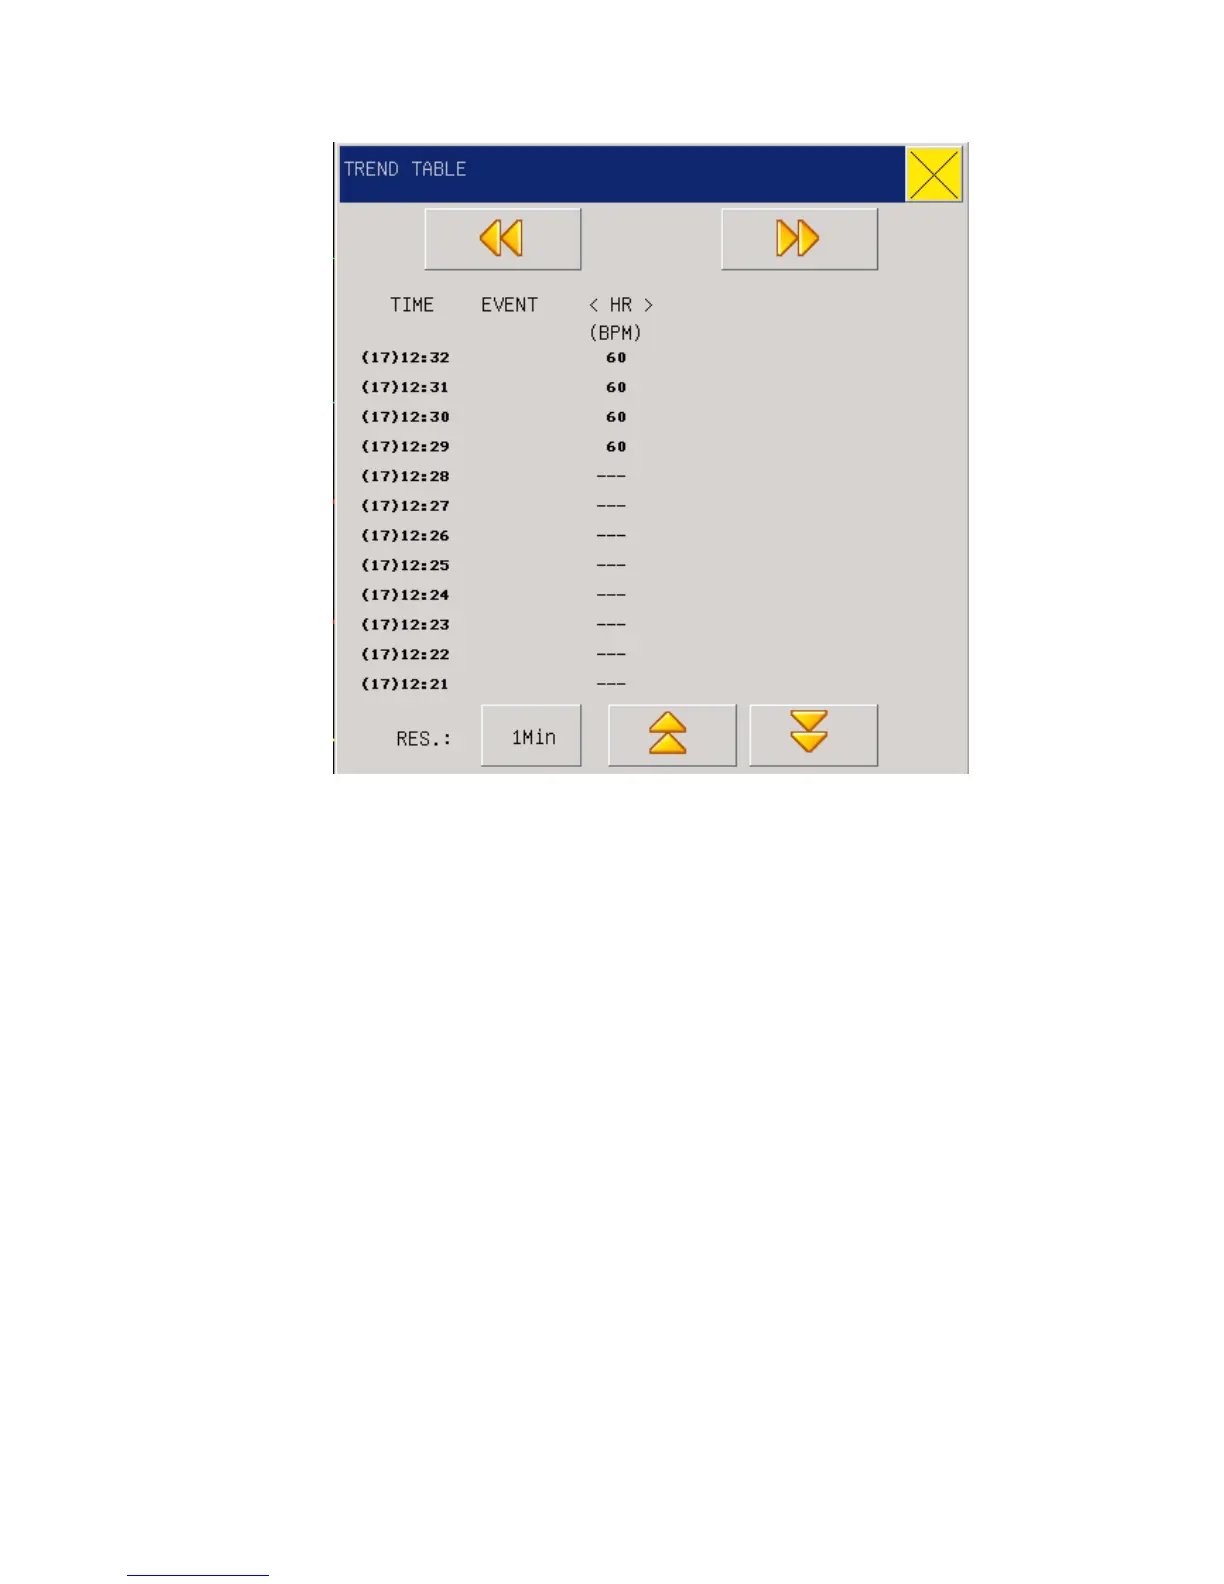
Fig 3-8 Trend Table
Time corresponding to various groups of TREND data is displayed at the left column, with dates
braced. What are listed is the cases that have once been marked, which corresponds to the time of
the marked cases. Parameters in the TREND Figures can be categorized into the following 9
groups:
HR,
ST1, ST2
RR,
T1,T2,TD
SPO
2
, PR
NIBP ((S/ D/M)DATE
IBP1(S/D/M)
IBP2(S/ D/M)
CO
2
INS AWRR
NIBP TREND data has its own characteristics; besides of measured values, below each
“measurement point” there is time for this NIBP measurement.
3.8 NIBP RECALL