37
Chapter6 Trend
It can store 120 hours trend data, 2000 NIBP and 500 alarm events and support recording.
Observation methods are provided in this chapter.
6.1 TREND GRAPH (TREND Diagram)
TREND diagram for the latest 1 hour can be displayed one data per second or one data per five
seconds;
TREND diagram for latest 120 hours can be displayed one data per minute, per 5 minutes, or per
10 minutes.
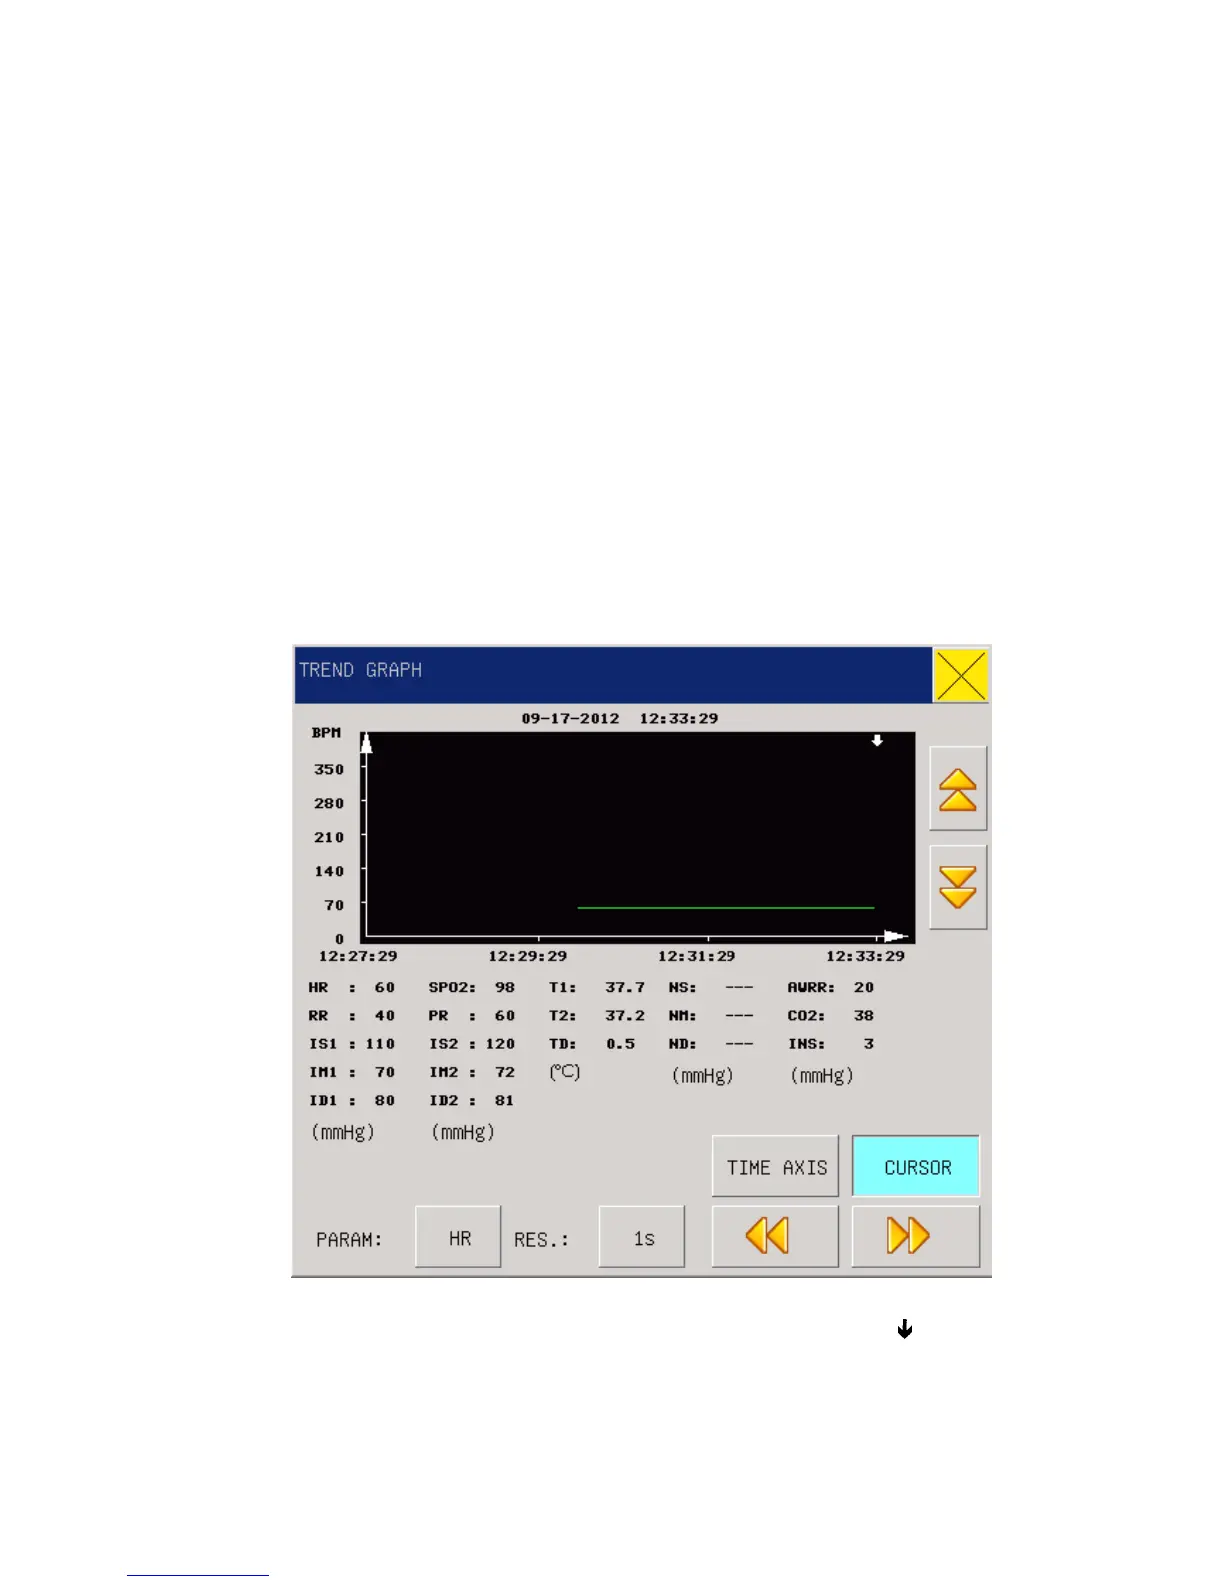
Select “TREND GRAPH” in the “MAIN MENU” to pop up the following TREND figure:
Fig 6-1 Trend Graph
Vertical axis is for measured values and horizontal axis for measurement time. The “ ” symbol is
the cursor for TREND diagrams, and the measured value at the position it arrows is displayed
below the TREND diagram while its corresponding time is displayed above the TREND diagram.