5-78 750/760 Feeder Management Relay GE Multilin
5.7 S6 MONITORING 5 SETPOINTS
5
5.7.4 DEMAND
a) MAIN MENU
PATH: SETPOINTS ÖØ S6 MONITORING ÖØ DMND
Current demand is measured on each phase, and on three phases for real, reactive, and apparent power. Setpoints allow
the user to emulate some common electrical utility demand measuring techniques for statistical or control purposes.
The relay is not approved as or intended to be a revenue metering instrument. If used in a peak load control sys-
tem, the user must consider the accuracy rating and method of measurement employed, and the source VTs and
CTs, in comparison with the electrical utility revenue metering system.
The relay can be set to calculate demand by any of three methods.
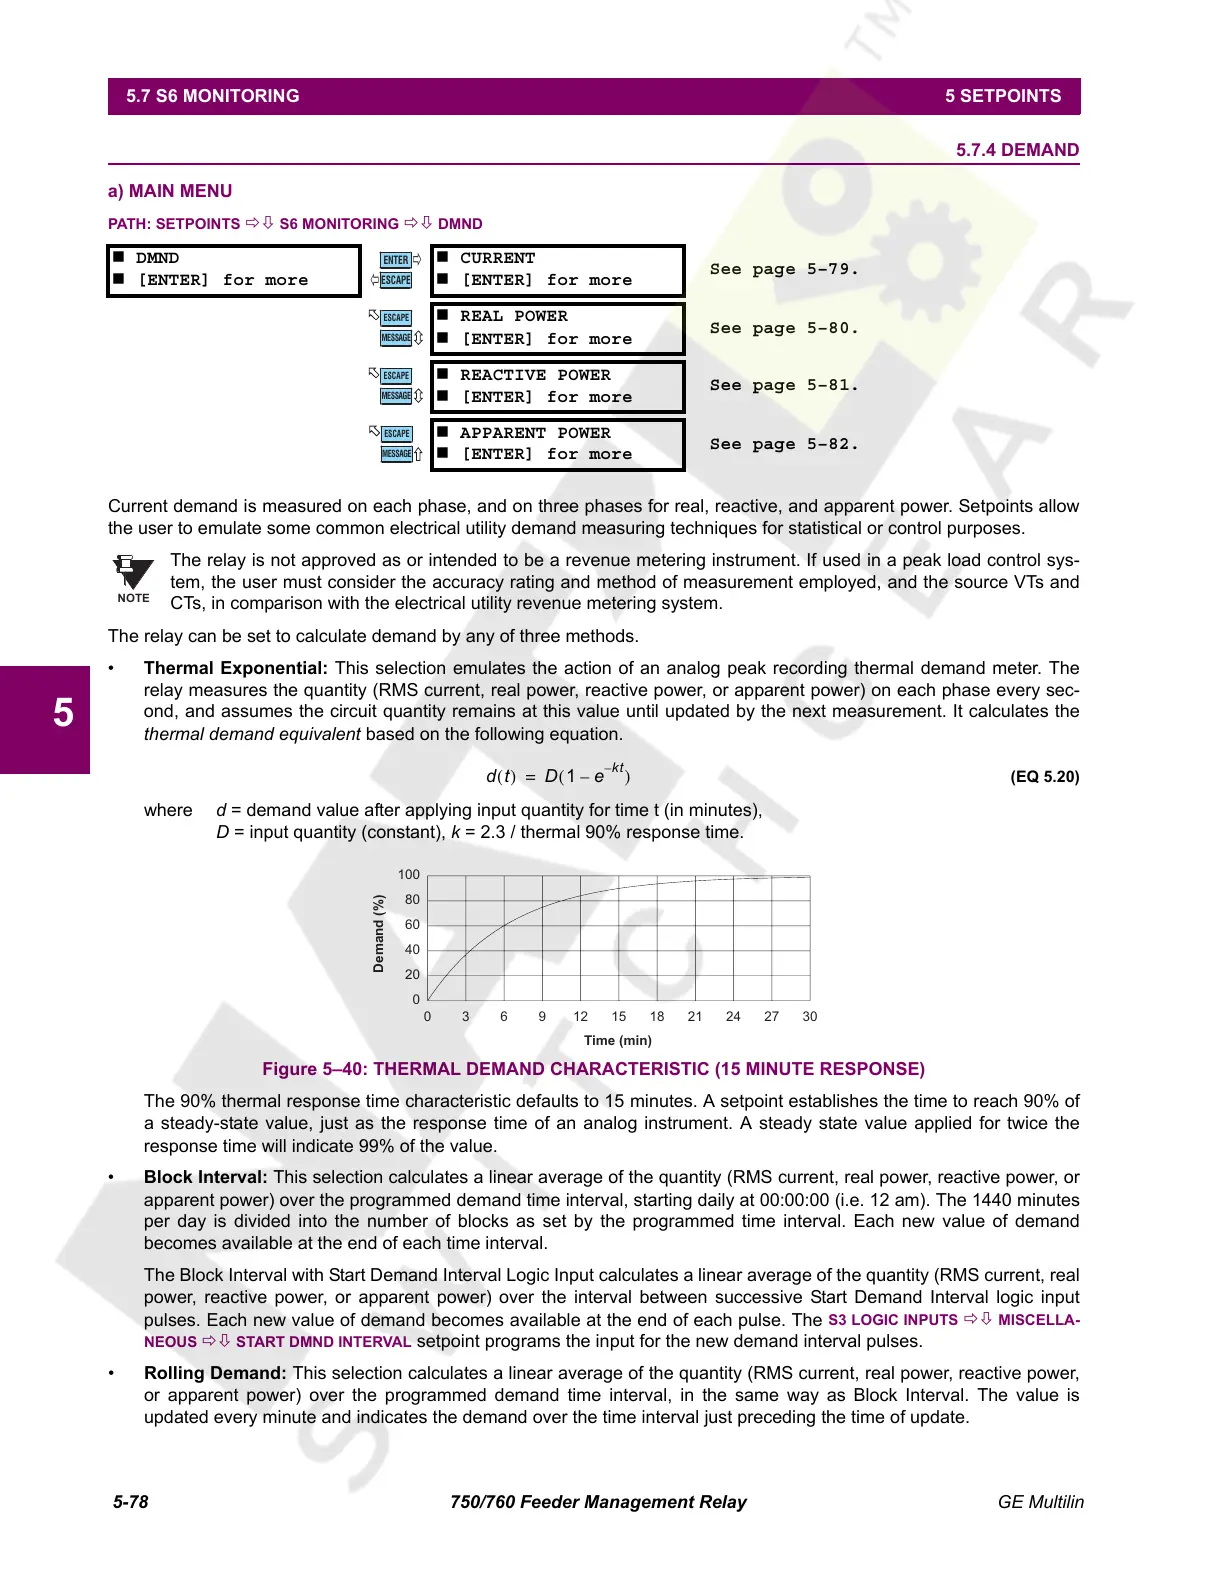
• Thermal Exponential: This selection emulates the action of an analog peak recording thermal demand meter. The
relay measures the quantity (RMS current, real power, reactive power, or apparent power) on each phase every sec-
ond, and assumes the circuit quantity remains at this value until updated by the next measurement. It calculates the
thermal demand equivalent based on the following equation.
(EQ 5.20)
where d = demand value after applying input quantity for time t (in minutes),
D = input quantity (constant), k = 2.3 / thermal 90% response time.
Figure 5–40: THERMAL DEMAND CHARACTERISTIC (15 MINUTE RESPONSE)
The 90% thermal response time characteristic defaults to 15 minutes. A setpoint establishes the time to reach 90% of
a steady-state value, just as the response time of an analog instrument. A steady state value applied for twice the
response time will indicate 99% of the value.
• Block Interval: This selection calculates a linear average of the quantity (RMS current, real power, reactive power, or
apparent power) over the programmed demand time interval, starting daily at 00:00:00 (i.e. 12 am). The 1440 minutes
per day is divided into the number of blocks as set by the programmed time interval. Each new value of demand
becomes available at the end of each time interval.
The Block Interval with Start Demand Interval Logic Input calculates a linear average of the quantity (RMS current, real
power, reactive power, or apparent power) over the interval between successive Start Demand Interval logic input
pulses. Each new value of demand becomes available at the end of each pulse. The
S3 LOGIC INPUTS ÖØ MISCELLA-
NEOUS ÖØ START DMND INTERVAL setpoint programs the input for the new demand interval pulses.
• Rolling Demand: This selection calculates a linear average of the quantity (RMS current, real power, reactive power,
or apparent power) over the programmed demand time interval, in the same way as Block Interval. The value is
updated every minute and indicates the demand over the time interval just preceding the time of update.
DMND
[ENTER] for more
CURRENT
[ENTER] for more
See page 5–79.
REAL POWER
[ENTER] for more
See page 5–80.
REACTIVE POWER
[ENTER] for more
See page 5–81.
APPARENT POWER
[ENTER] for more
See page 5–82.
ENTER
ESCAPE
ð
ð
MESSAGE
ESCAPE
MESSAGE
ESCAPE
MESSAGE
ESCAPE
NOTE
dt() D 1 e
kt–
–()=
Time (min)
0
20
40
60
80
100
0 3 6 9 12 15 18 21 24 27 30
Demand (%)
Courtesy of NationalSwitchgear.com
 Loading...