13
QUICK START GUIDE
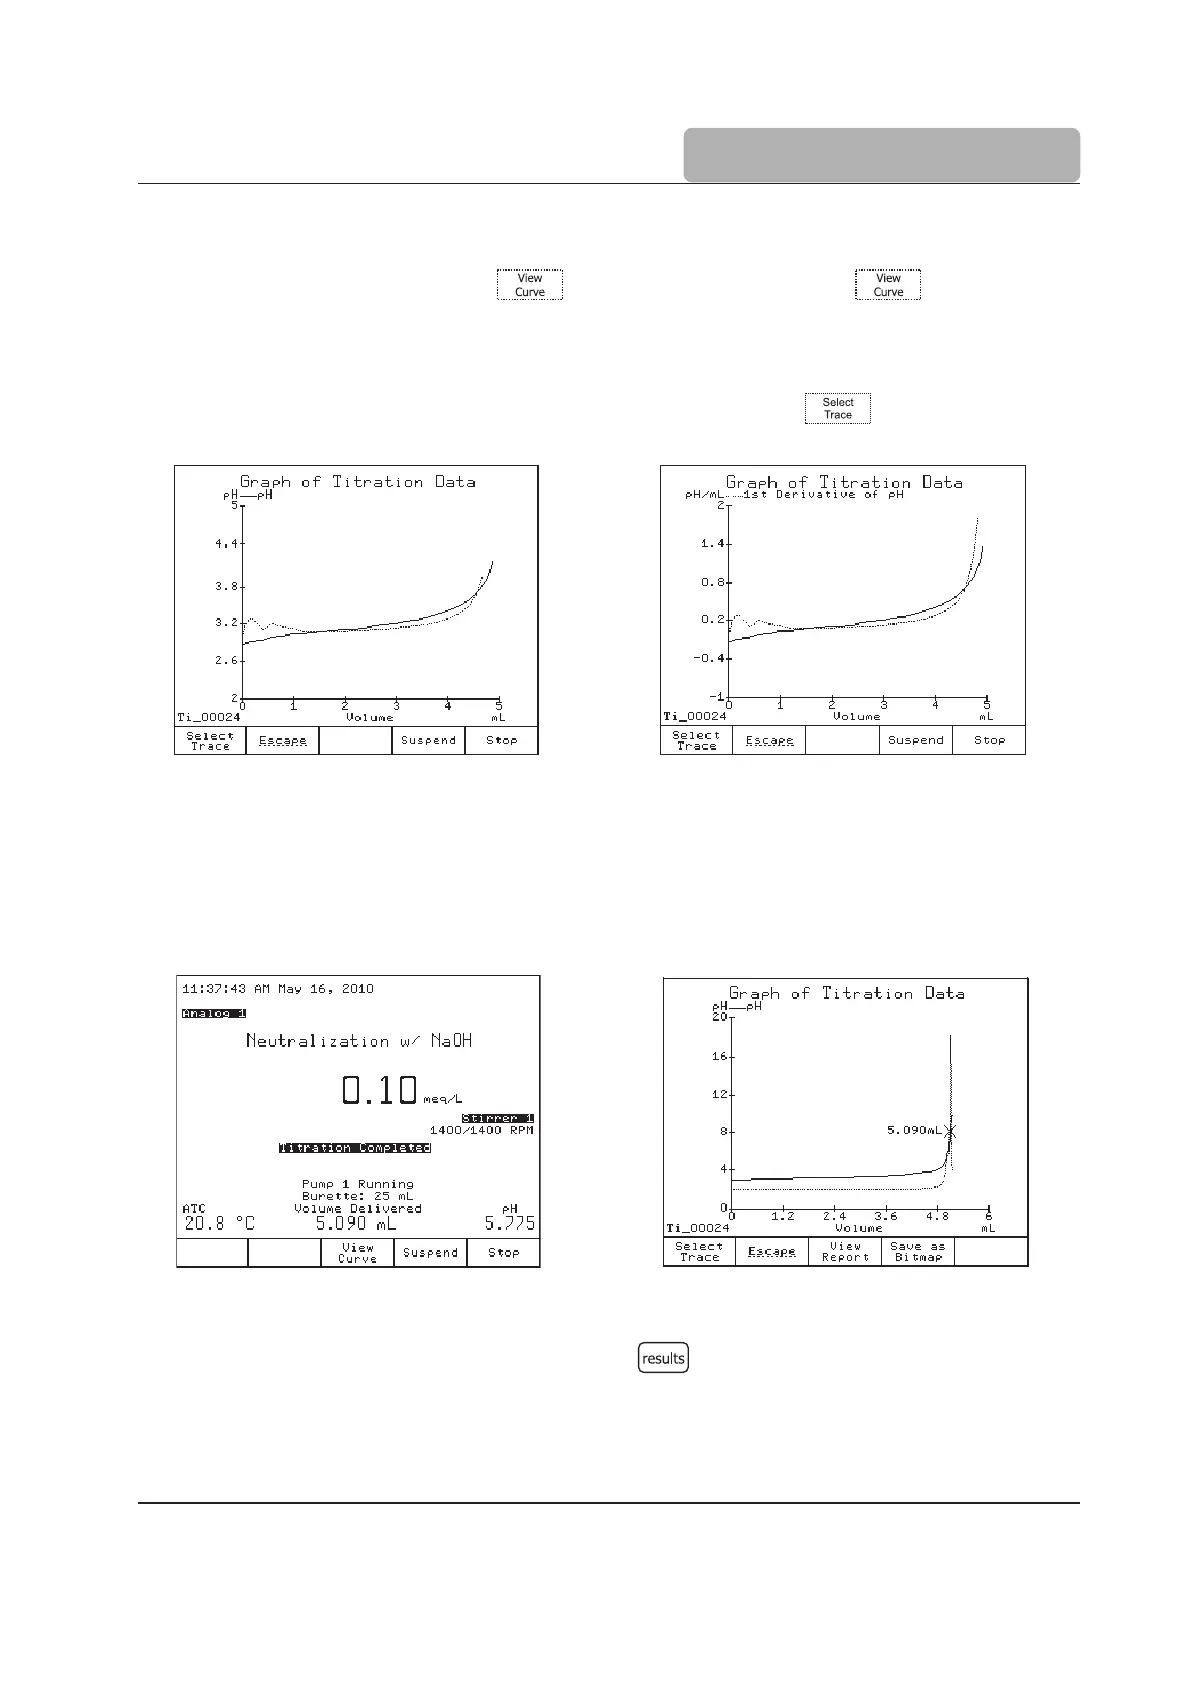
Viewing Graph During Titration
After a few doses are dispensed will become active. Press to display the
real-time titration graph.
The curves displayed are plots of the pH and the 1
st
derivative versus Titrant Volume (for
details, see the Instruction Manual).
The two graphs are scaled to fit in the same screen window. Press to change the y-axis
scale to either the pH values or the 1
st
derivative values.
Titration Termination
The titration is normally terminated when the first equivalence endpoint is detected according
to the selected algorithm. To ensure the correct detection and interpolation of the equivalence
endpoint, the titrator will dispense a few additional doses after the endpoint was reached.
The titration result can be displayed either in the main
screen or in the
Graph of Titration
Data
screen:
When the titration has ended, the titrator will display the equivalence endpoint volume and the
final concentration of the analyte together with the Titration Completed message.
To view the titration graph and/or results, press .
When the titration ends, an “x” will mark the endpoint on the pH versus titrant volume curve
in the
Graph of Titration Data
screen. The value of the endpoint volume is also displayed
next to the endpoint.
 Loading...