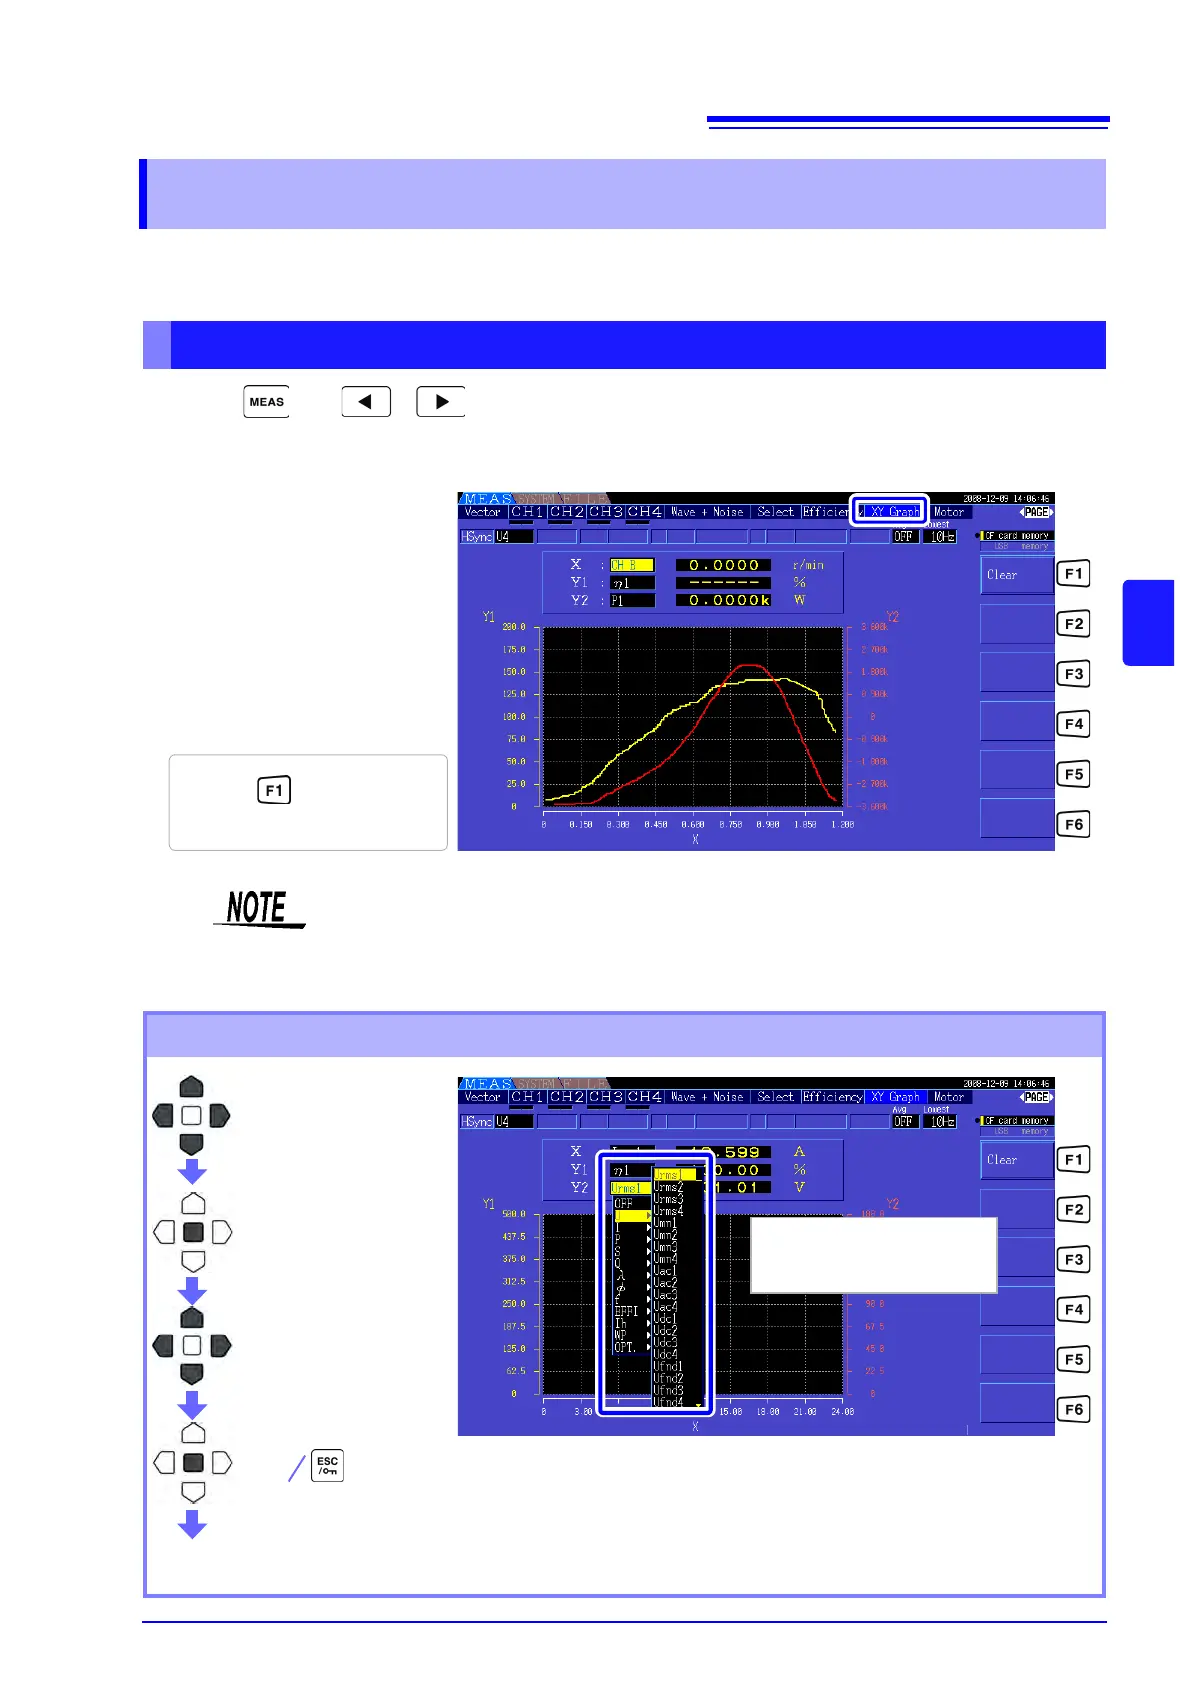
5.4 X-Y Plot Function
97
5
Chapter 5 Operating Functions
Select parameters for x and y (horizontal and vertical) axes in the basic measurement items to create
simple X-Y graphs. Plot screens can be saved and printed as screen capture images.
Press and key to display the [XY Graph] page
X-Y graph plotting starts, and proceeds at the display update rate.
5.4 X-Y Plot Function
XY Graph Display
Press to clear and
restart plotting.
• Plotted data is not stored in memory, so it is lost when the screen is changed.
• When the items with AUTO ranging is selected, the data is cleared when the internal
range is switched in AUTO ranging.
Display Setting Procedure
Enter
Select a parameter for
display.
Cancel
Enter
(Displays the pull-down menu)
Displayed data is cleared, and plotting restarts.
Move the highlight cur-
sor the display item
(parameter) to change.
Display item (Parameter)
One x-axis parameter and two
y-axis parameters can be set.