4.6 Viewing Noise Measurement Values (FFT Function)
72
Perform FFT analysis on a selected channel's voltage and current to display noise up to 100 kHz as a
graph and as numerical values. This function is convenient for monitoring an inverter's carrier frequency,
harmonic noise ingress on commercial power lines, or DC power.
The numerical noise values can be saved to storage media.
See "7.6 Saving Waveform Data" (p. 114)
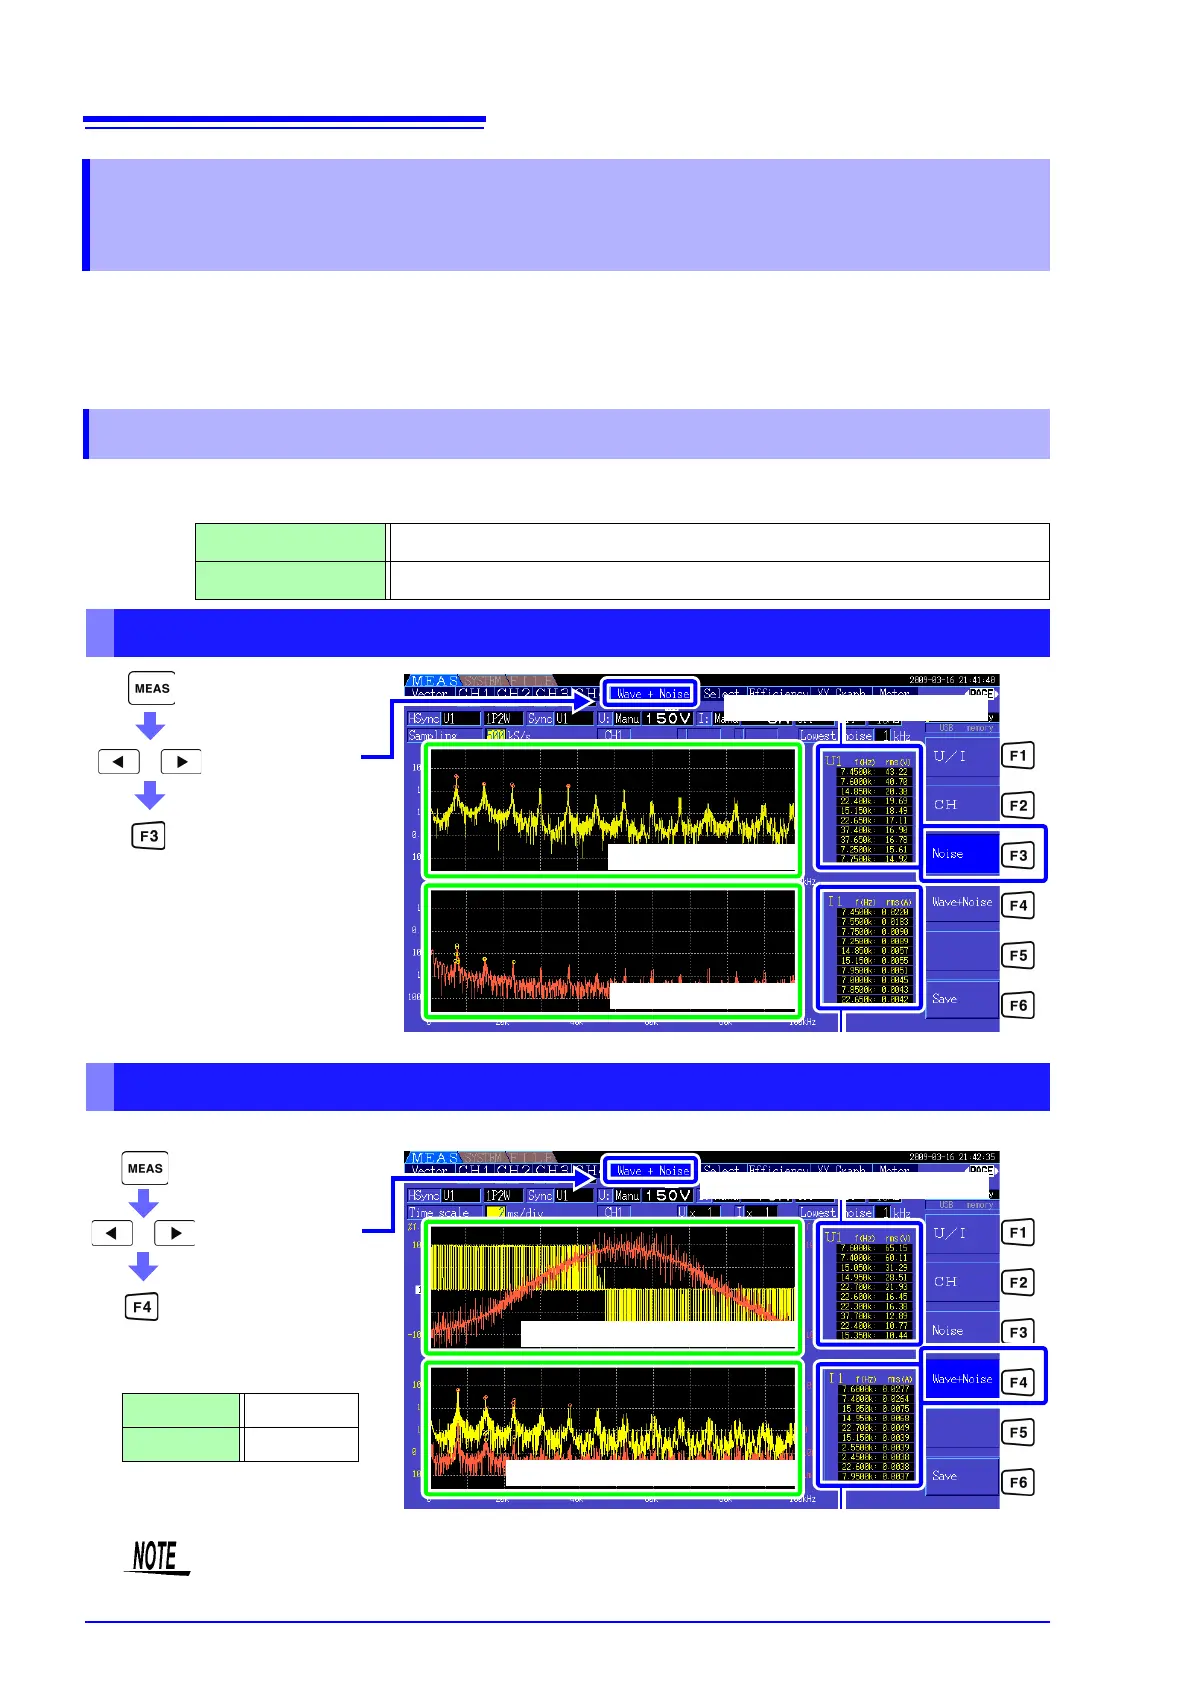
Noise voltage and current can be displayed in separate graphs along with numerical values.
Numerical noise voltage and current values at ten frequencies are displayed in order of decreasing amplitude.
The waveform to be analyzed and it's noise analysis results can be displayed at the same time.
4.6 Viewing Noise Measurement Values
(FFT Function)
4.6.1 Displaying Noise Voltage and Current
Horizontal Axis Linear frequency scale
Vertical Axis Logarithmic noise amplitude scale
Displaying Noise
Select [Noise]
Display the
[Wave + Noise] page
Noise Voltage Graph
Noise Current Graph
Noise Voltage Numerical Value
Noise Current Numerical Value
Displaying Waveforms and Noise
Select [Wave + Noise]
Display the
[Wave + Noise] page
Voltage and Current Waveforms
Voltage and Current Noise Graphs
Noise Voltage Numerical Value
Waveform Colors
Voltage Yellow
Current Red
Noise Current Numerical Value
The waveform and noise display cannot be updated by pressing the HOLD key when the unit is
under HOLD condition.