6 Building air conditioning controls
CSNET Manager LT/XT
TCGB0106 rev.0 - 12/2014
576576
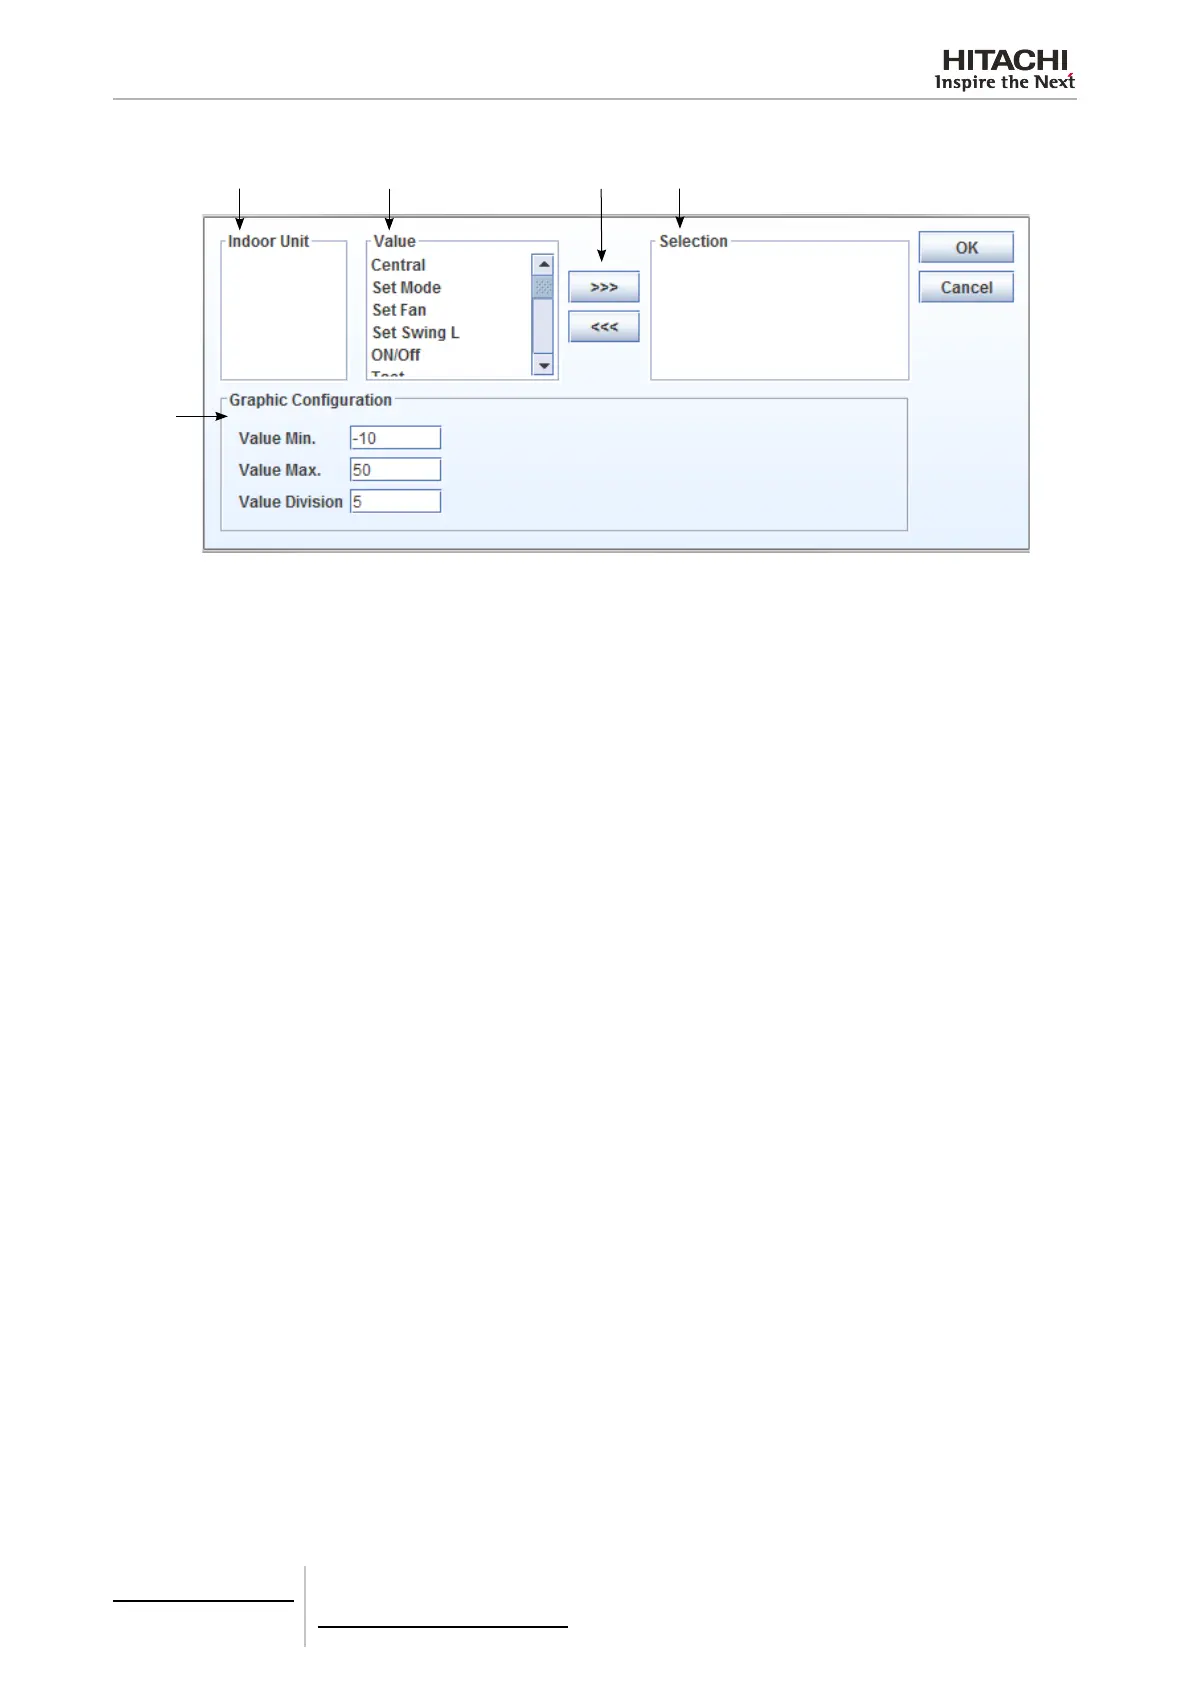
The graph conguration window has several elds:
1 2 3 4
5
1 Indoor unit: Select the address of the indoor unit to be displayed.
2 Value: Contains the different values that can be displayed for the unit or cycle. See section on “Values table for
packaged units” for an explanation of each parameter.
3 Selection buttons: Permit the addition or the elimination of a series (unit + value) of the display.
4 Selection: Series to display.
5 Graph conguration: Permits the conguration of the graph display. The “Value min” eld permits the selection of the
minimum on the Y axis and the “Value max” eld permits the selection of the maximum on the Y axis. “Value division”
establish the intervals between lines.
To generate a graph:
• Select the unit (indoor unit or cycle) you wish to add to the series.
• Select the value for the unit you wish to add.
• Press the “>>>” button to add the selection to the series list.
• Repeat steps 1 to 3 to add the different series required on the list. To delete a selected series, select the series list and
press the “>>>” button.
• Congure the graph as required.
• Press “OK” to update and return to CSNET Manager.
Use the lower scroll bar to select the day. Change the day in the Day eld.
The Export button permits the capture of a graphic in JPG format. The Print button permits the graph to be printed.
 Loading...