IS810N-INT Series Servo System User Manual (Brief)Chapter 6 Commissioning Software
- 169 -
Shows all parameters of a selected drive;
Shows only the parameters different from defaults;
Shows only the parameters that have been modied during commissioning;
Shows only the parameters that have been modied but not written to the drive;
Shows only the parameters different from the values in the current imported parameter
record le.
15> Short-cut menus. They are used to:
Read selected parameters; write selected parameters; add to the monitoring list; add as
self-dened parameters; delete from self-dened parameters; show system changeover
(between the decimal and hexadecimal systems if the conditions are satised).
16> Prompt color : The current value is different from the default.
: The parameter value has been modied but not written to the drive.
•
Continuous OSC
Choose
Function view
>
Continue OSC
and double-click.
Functional Description:
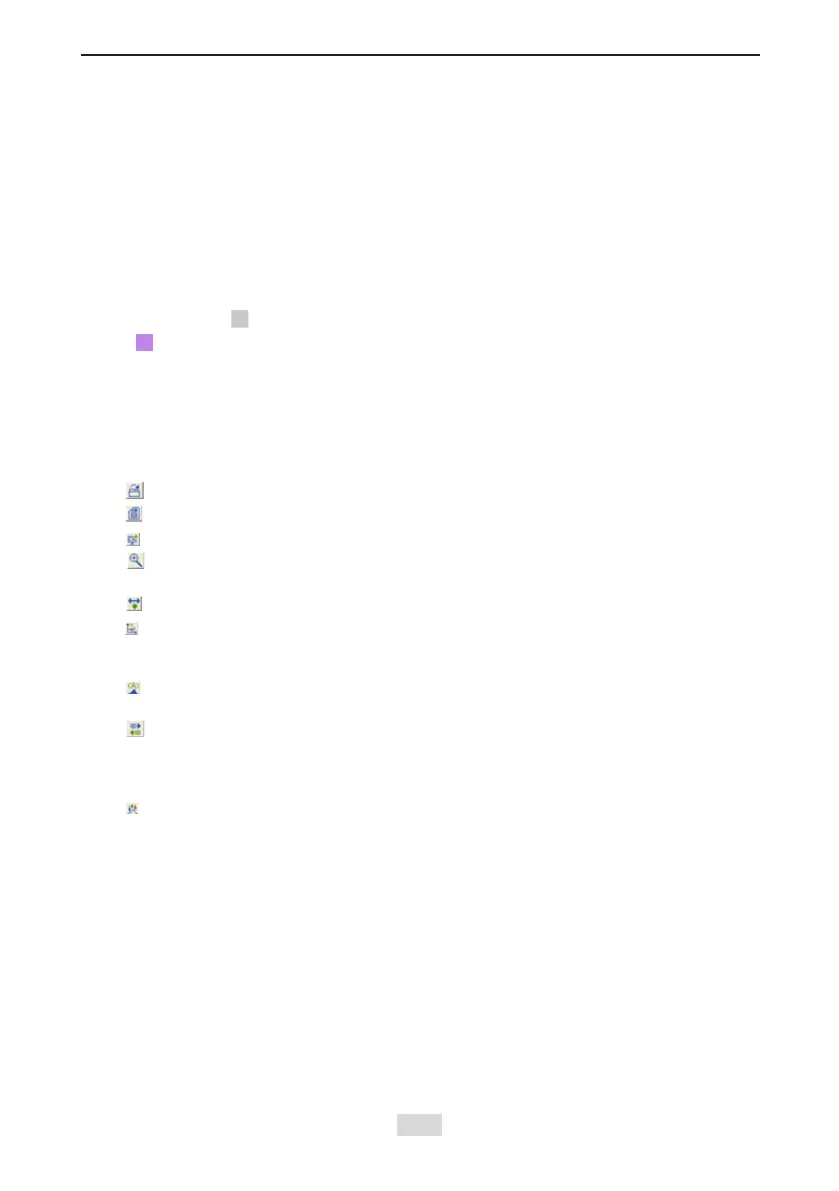
Toolbar buttons
1> : Open a historical data le (.csv).
2> : Save the current sampling data to a .csv le.
3> : Save the current sampling waveform to a .bmp le.
4> : Zoom in in a specied waveform area. When you right-click the waveform area, the
zoom-in is canceled. This function is exclusive with the
Move
function.
5> : Enable the horizontal movement. This function is exclusive with the Circle function.
6> : Display the coordinates of a sampling point. When the pointer is moved to the
waveform area, coordinates are displayed. When the pointer is move out of the waveform
area, coordinates are not displayed.
7> : Display curve names (channel names) in the waveform area or on the leftmost of
waveforms.
8> : Open the vernier window. There is one group of verniers (A, B) in the horizontal
and vertical direction each. The distance between verniers can be locked. The vernier
window displays information about sampling points of each channel corresponding to
verniers A and B.
9> : Highlight waveform curve sampling points (dots).
Drawing area
1> Scale area: Show the Y-scale on the left and X-axis (time axis) at the bottom.
2> Waveform display area: Draw curves composed of sampling points.
Channel information
1>ID: Show channel numbers.
2> Channel variable: Switch between channel variables.
3> Show: Show or hide waveform curves.
4> Color: Set the colors of curves and scales.
5> Scale: Show or hide Y-axis scale information.
6> Longitudinal scale:
 Loading...