CEAST 9340 - Instructions for Use and Maintenance 7510.000MN1r ed. 1 rev. 1 - Page 179
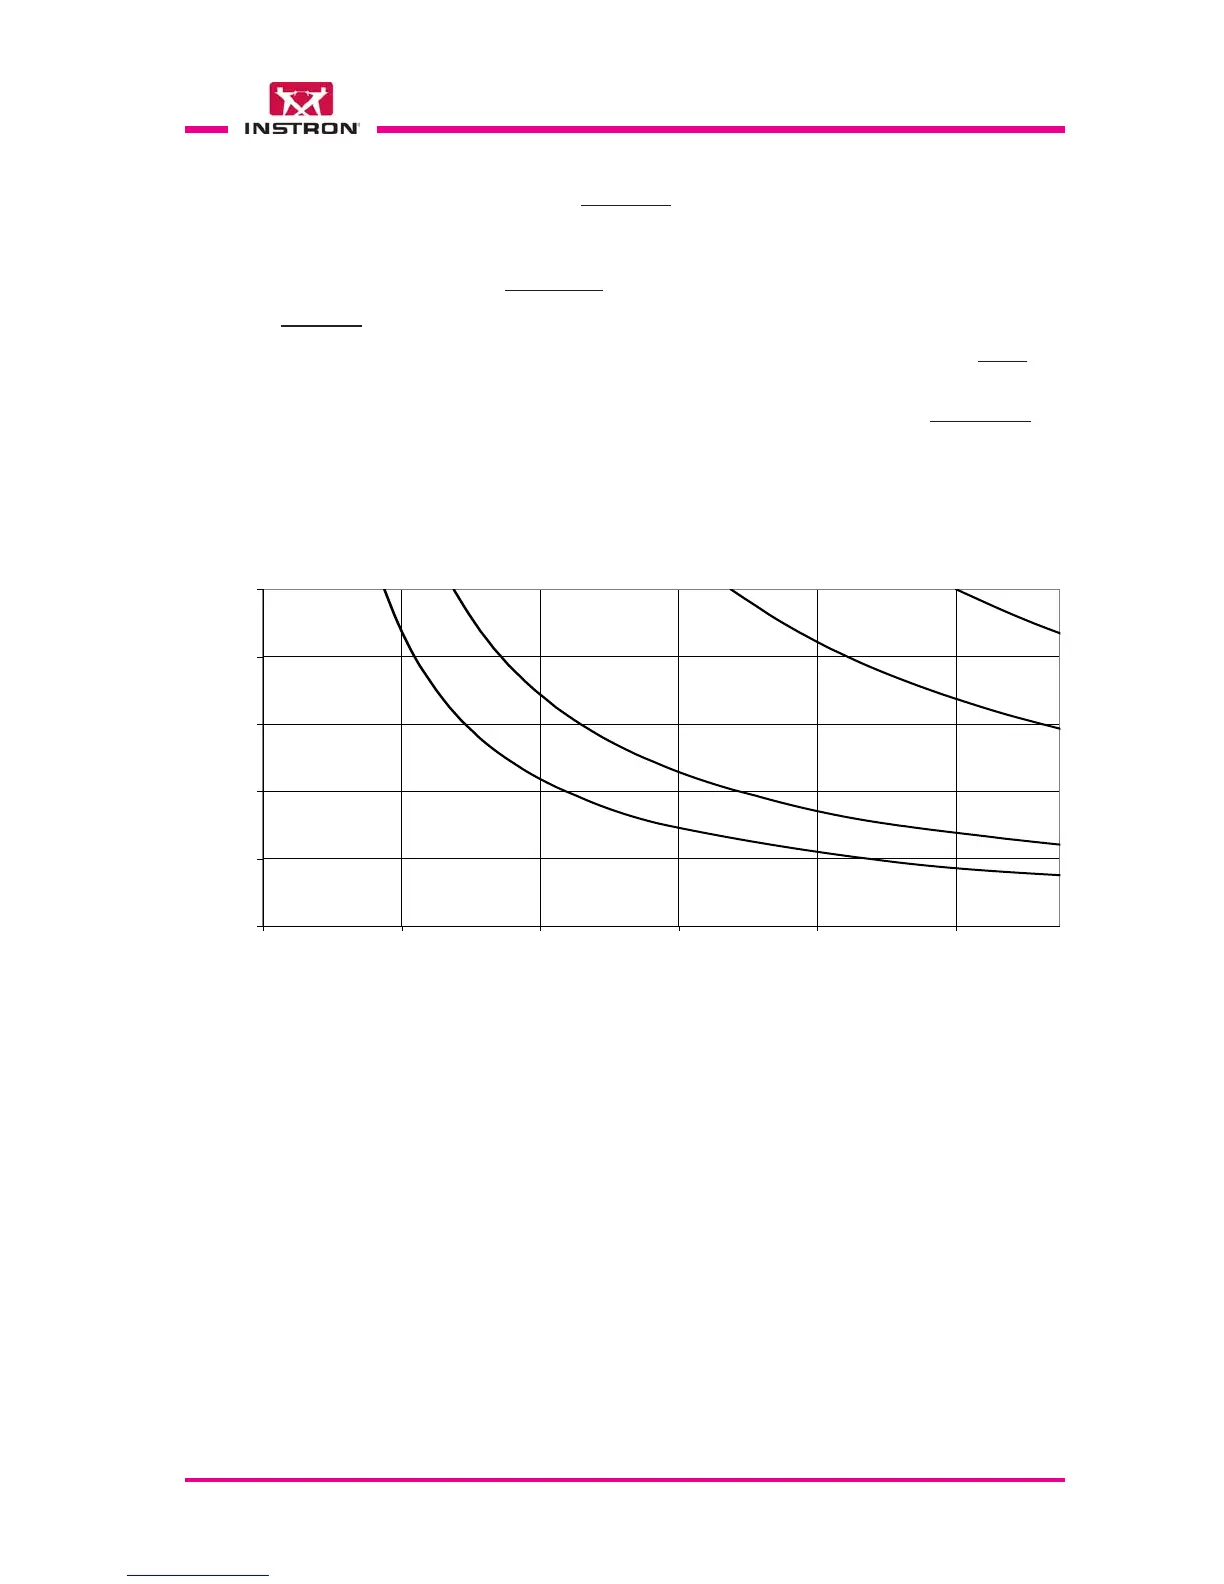
On the graph 2 is visualized the maximum “Residual Energy [%]” of the striker after
impact, versus the striker “Drop Height [m]”, so that the system is able to avoid the
rebound (second impact on the specimen).
The curve represented is
dependent from the mass of the striker.
Example: mass of the striker 30 kg released from 1 m:
• If the residual energy after impact is < 20 %, the antirebound system
stops the
striker avoiding the rebound;
• If the residual energy after impact is > 30 %, the antirebound system
do not stop the
striker.
Graph 2
Residual energy [%]
Drop height [m]
Maximum allowed Residual energy versus Drop height
0
20
40
60
80
100
0.0 0.2 0.4 0.6 0.8 1.0
20 kg
30 kg
10 kg
37 kg
 Loading...