256 8163A/B, 8164A/B, 8166A/B User’s Guide
10 Applications
Figure 155 Samples Display - <Samples & Line>
2 Move to your selected option and press Enter.
3 Press the [Close] softkey to return to the graph.
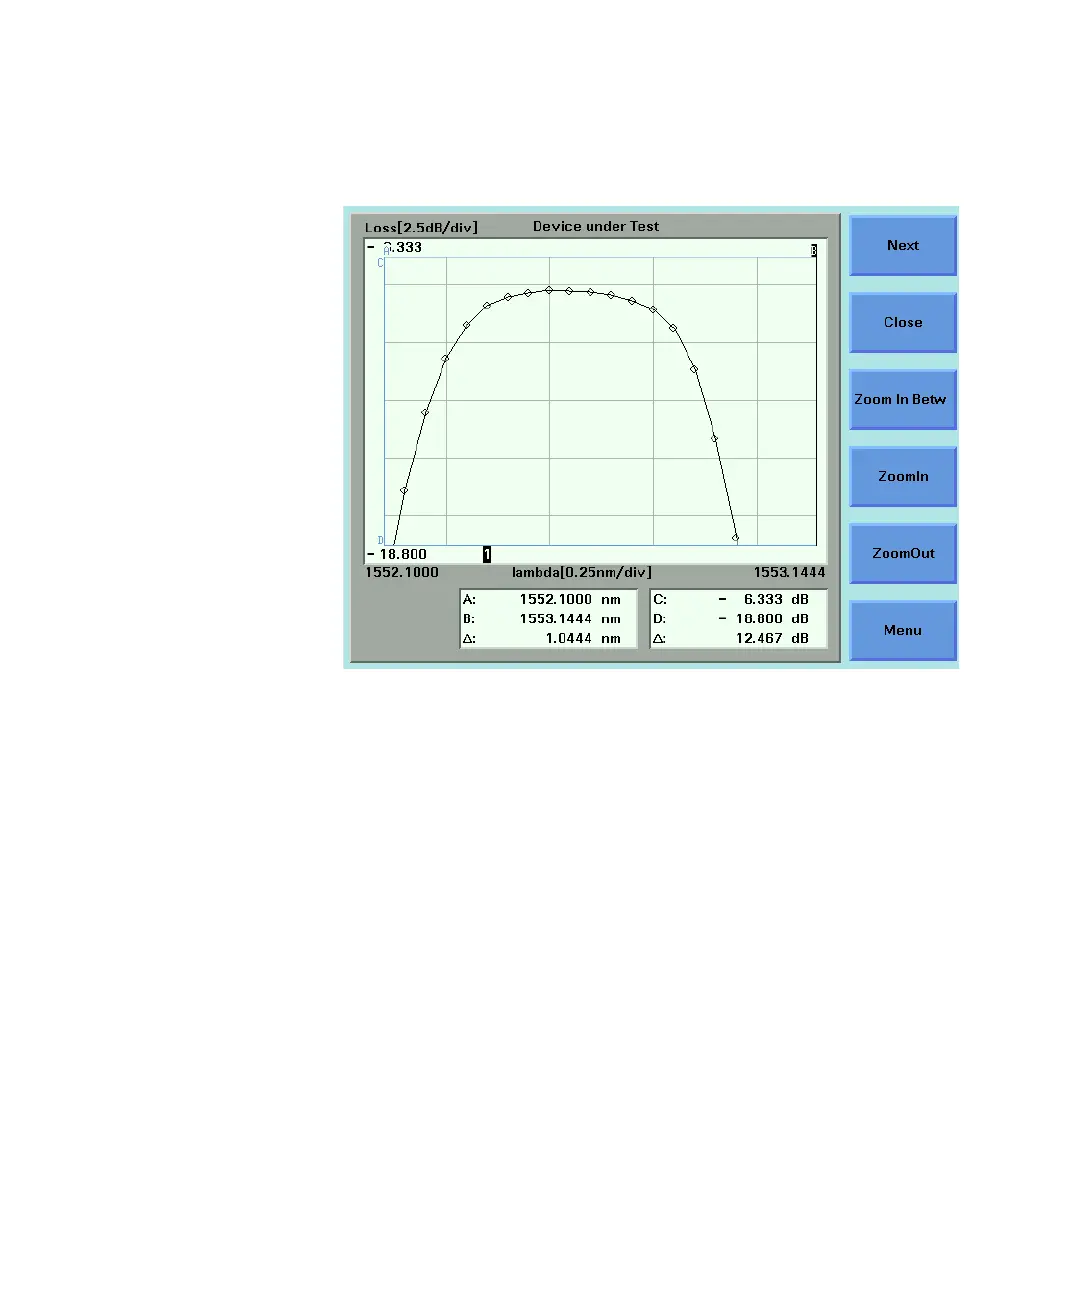
How to Read Curve Values
You can lock markers A or B to a curve in order to move between individual
samples. In this way, you can read the time/wavelength and power values
that relate to each sample and the difference between these values for
markers A and B.