160 Keysight B2980B User’s Guide, Edition 1
Front Panel Reference
Display and Assist/Function Keys
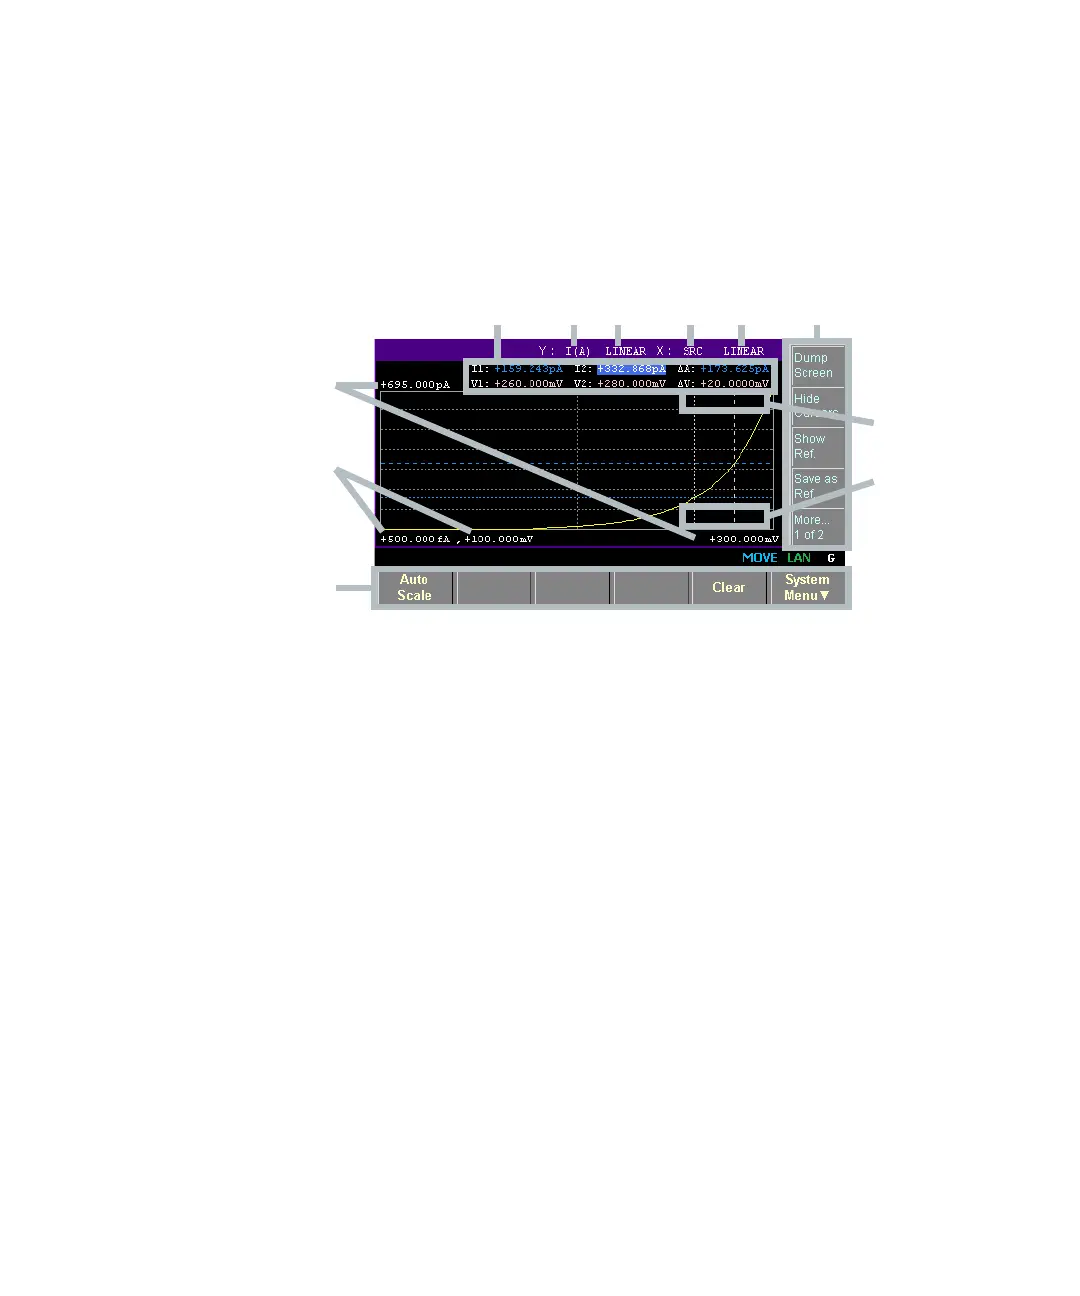
Graph View
Displays the graph for plotting the measurement or math result. The Graph view
can plot up to 5000 data.
Display area 1. Y-axis data type: I (A), Q (C), V (V), R (), or MATH (see Table 4-3). Select one
using the assist keys.
B2981B/B2983B: I (A) or MATH
B2985B/B2987B: I (A), Q (C), V (V), R (), or MATH
2. Y-axis scale: LINEAR or LOG. Select one using the assist keys.
3. X-axis data type: I (A), Q (C), V (V), R (), MATH, SRC or t (s) (see Table 4-3).
Select one using the assist keys.
B2981B/B2983B: I (A), MATH, or t (s)
B2985B/B2987B: I (A), Q (C), V (V), R (), MATH, SRC, or t (s)
4. X-axis scale: LINEAR or LOG. Select one using the assist keys.
5. Graph maximum value
6. Graph minimum value