Keysight B2980B User’s Guide, Edition 1 165
Front Panel Reference
Display and Assist/Function Keys
Roll View
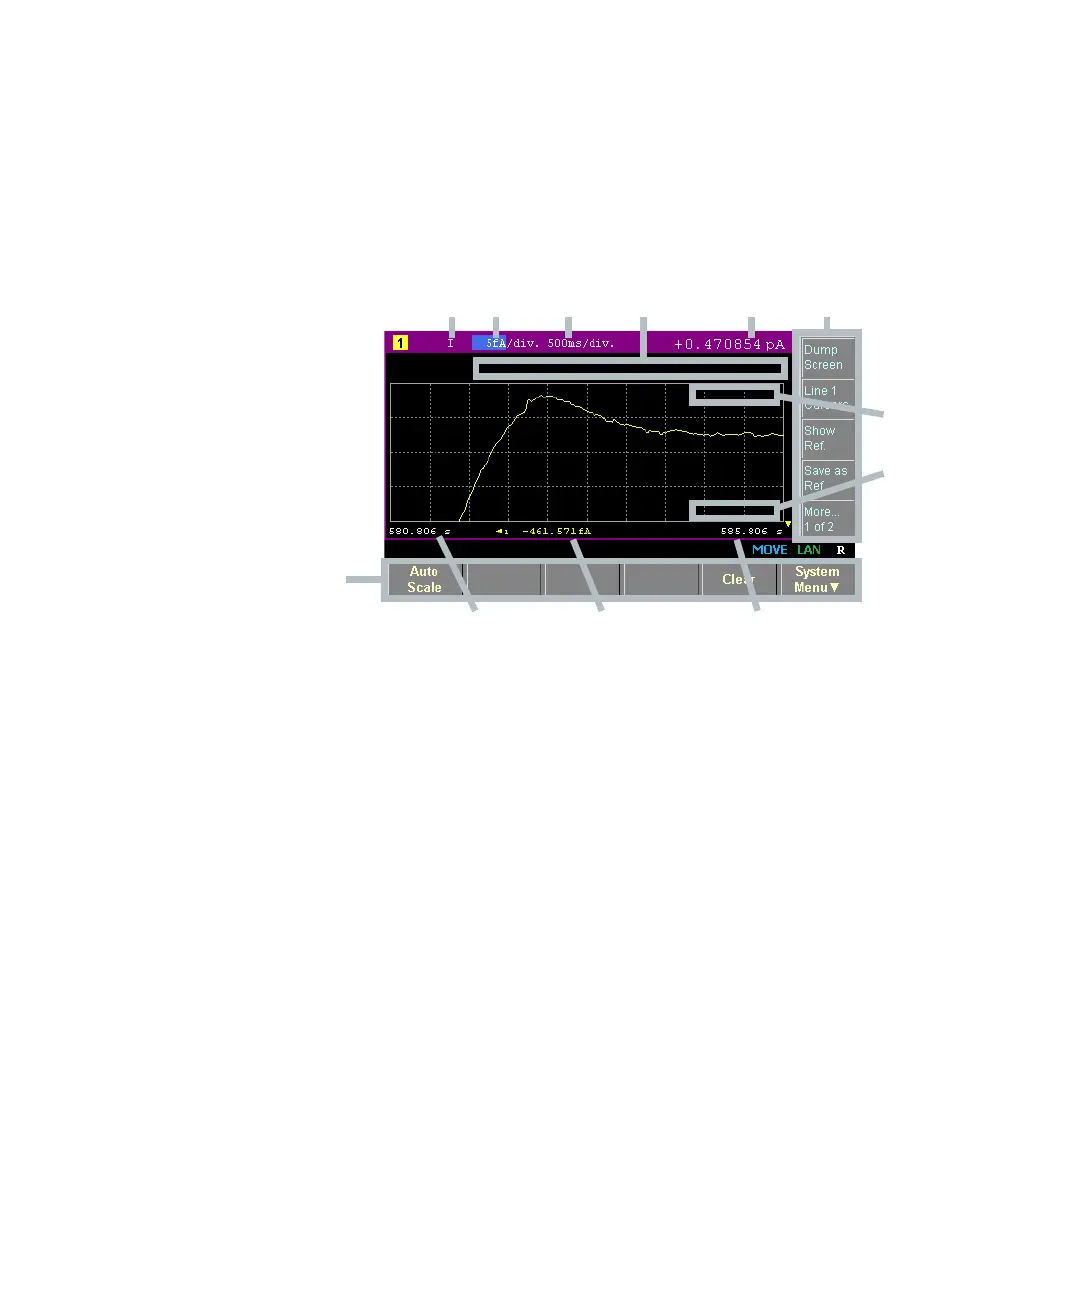
Displays the time domain graph for plotting the measurement data. See Table 4-5
for the Y-axis data types. The Roll view can plot up to 5000 data.
Display area 1. Y-axis data type: I, Q, V, or R. Select one using the assist keys.
2. Y-axis scale per division: A/div., C/div., V/div., or /div..
3. X-axis scale per division: s/div.
4. Latest measurement data
5. X-axis minimum value (minimum timestamp)
6. Y-axis offset values for line 1
7. X-axis maximum value (maximum timestamp)
8. (B2985B/B2987B) Output voltage value of the voltage source (controlled by
the Show Source or Hide Source assist key). If the Voltage Source On/Off
switch is turned on, the output value is displayed in yellow. You can change the
output voltage using this field.
9. Y-axis data at the active X-cursor position. ----.---- is displayed for the
no-data position.
10. Cursor data (controlled by the Line 1 Cursors or Hide Cursors assist key)