Gocator Snapshot Sensors: User Manual
Gocator Web Interface • 108
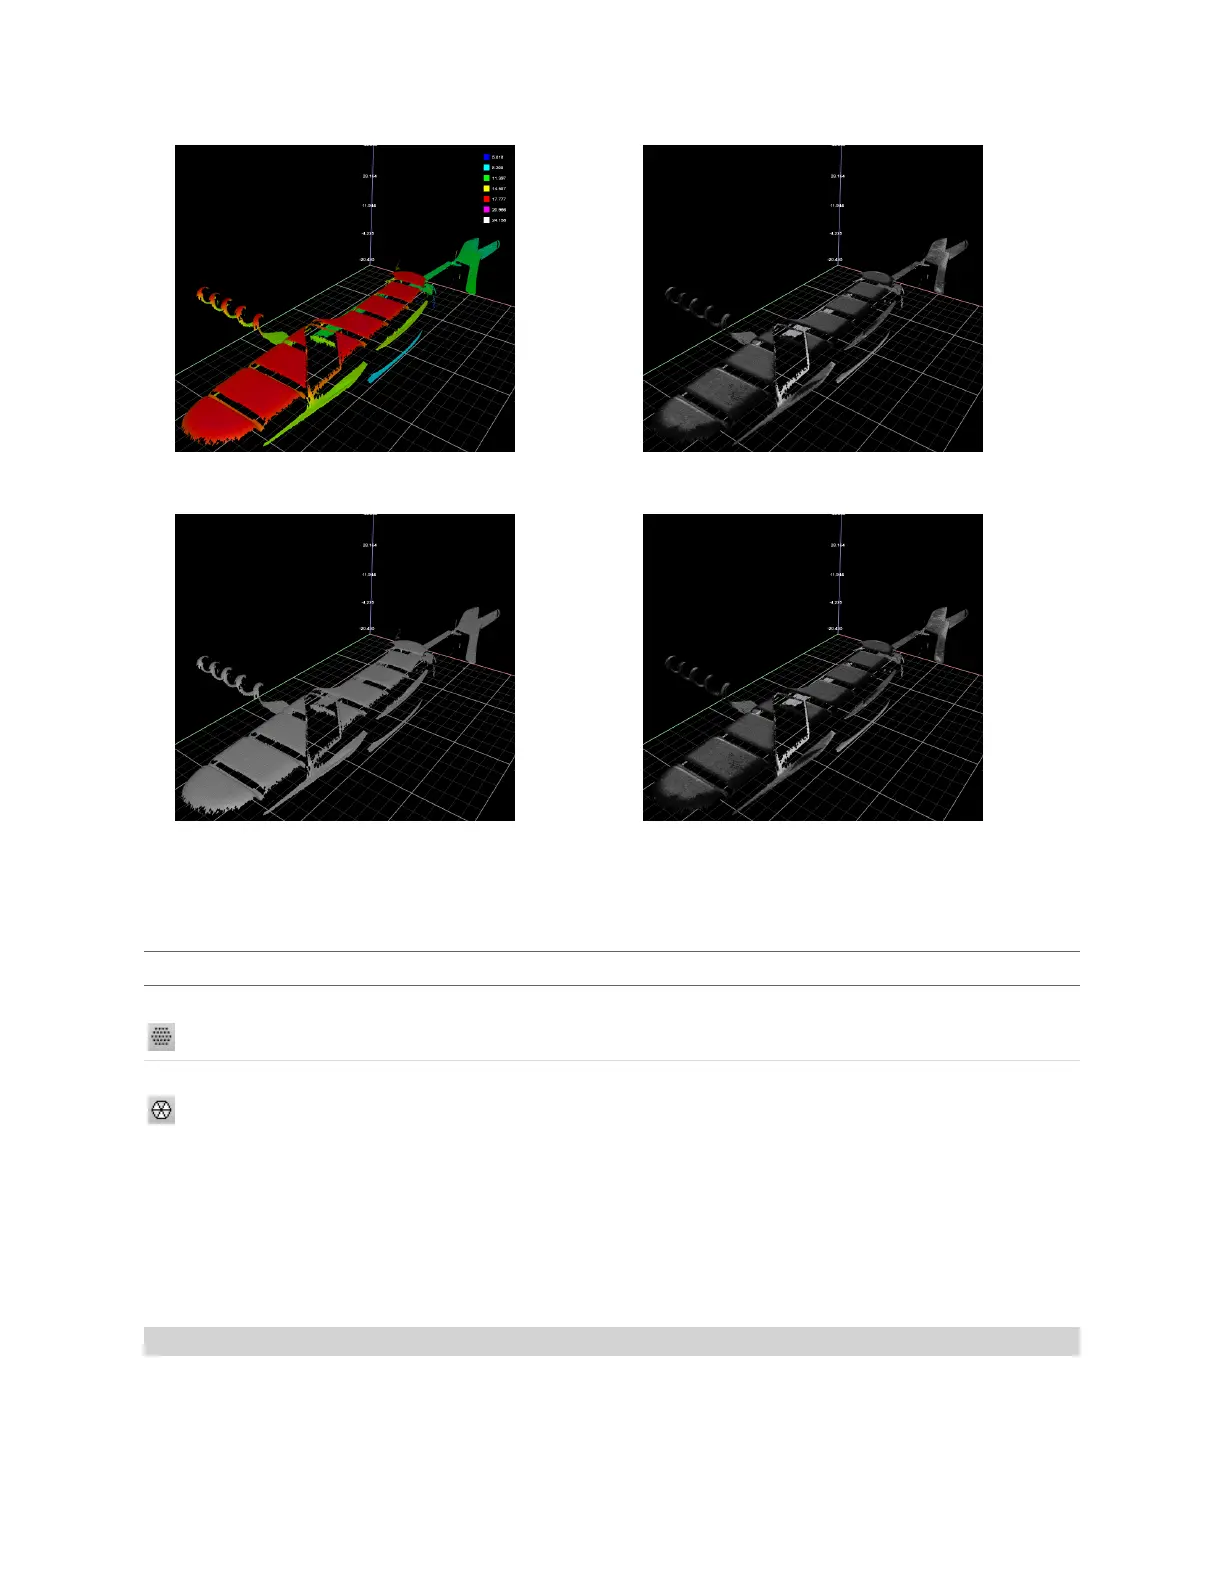
3D viewer with height map overlay 3D viewer with grayscale overlay
3D viewer with uniform overlay 3D viewer with uniform overlay
In 3D mode, you can choose how the data viewer renders the model:
Rendering Mode Description
Point Cloud (default) Renders 3Dmodels using point clouds. Useful in scan data that contains noise around edges,
and shows hidden structure.
Mesh Renders 3Dmodels using "meshing,"connecting 3Dpoint clouds with polygons.
To manually select the display type and the display view in the Scan page:
1. Go to the Scan page.
2. Select the View options in the data viewer.
Heightmap, Grayscale, Uniform, or Intensity can be selected from the left drop-down list.
Height Map Color Scale
Height maps are displayed in pseudo-color. The height axis (Z) is color-coded. The scaling of the height
map can be adjusted.
 Loading...