setView – sets the coordinate system
Syntax: ReturnValue = CallCWMethod
(GraphVarName, "
setView
", x1, y1, x2, y2)
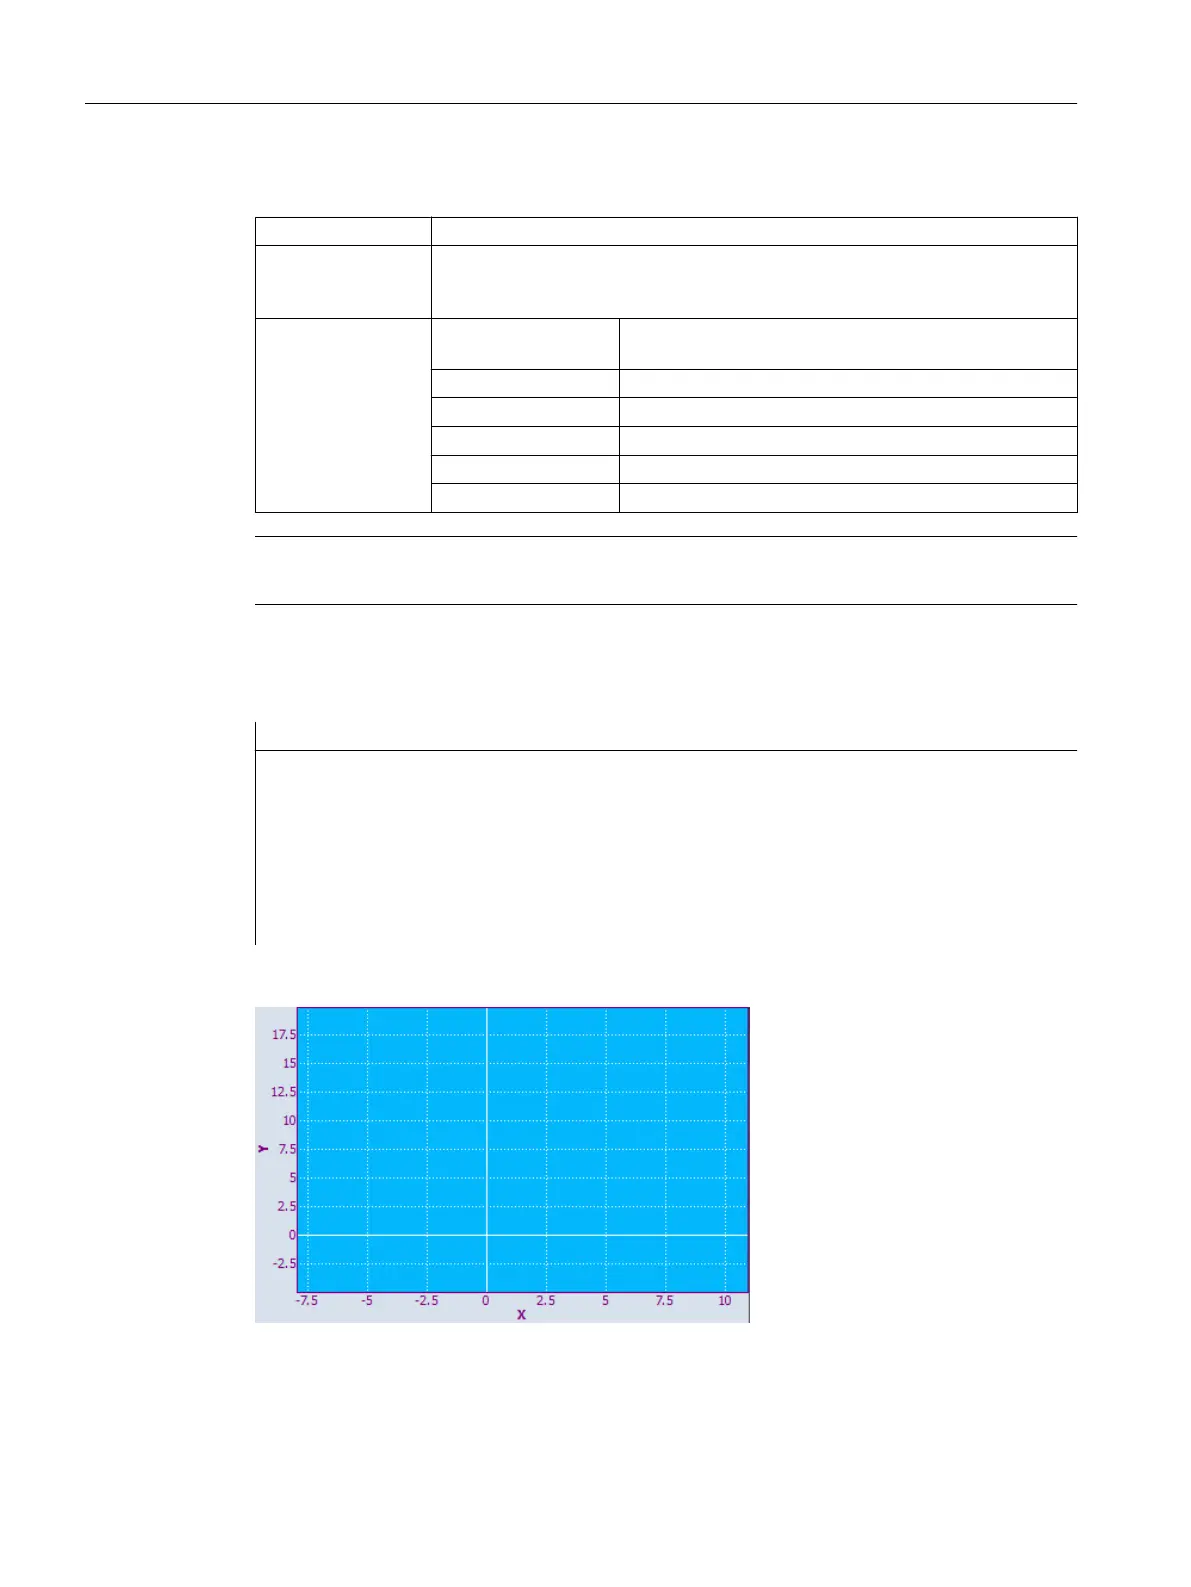
Description: Using this function, you define the size of the coordinate system that should be
displayed within the SlEsGraphCustomWidget. See also KeepAspectRatio prop‐
erty.
Parameters: GraphVarName Name of the display variable which contains a SlEs‐
GraphCustomWidget
Return Value Error code (bool): TRUE = successful
x1 left-hand edge (double)
y1 upper edge (double)
x2 right-hand edge (double)
y2 lower edge (double)
Note
This function automatically refreshes the display.
Example
setView(-8, -5, 11, 20)
AxisNameX = "X"
AxisNameY = "Y"
ScaleTextOrientationYAxis = 1
ScaleTextEmbedded = false
KeepAspectRatio = false
update
Figure 7-11 Example - setView
Graphic and logic elements
7.5 SIEsGraphCustomWidget
SINUMERIK Integrate Run MyScreens (BE2)
232 Programming Manual, 12/2017, 6FC5397-1DP40-6BA1
 Loading...