8 Contrast Imaging
96 Basic User Manual
0
5
10
15
S
5
24
48
72
96
10 15 20
25
30
1 PI: 1.02
1 TTP: 0.00
1 AT: 0.00
2 PI: 1.31
2 TTP: 1.10
2 AT: 0.00
0
499
249
T1: 00:20/00:15
T2: 00:15/00:10
S
1 1 0
C /P 5 /3 0
4
FPS 47
D/G 3/1
GN 255
I/P 3/30
PWR 70
FRQ 3-4.8
D 16.5cm
GN
PWR
CA
1 2
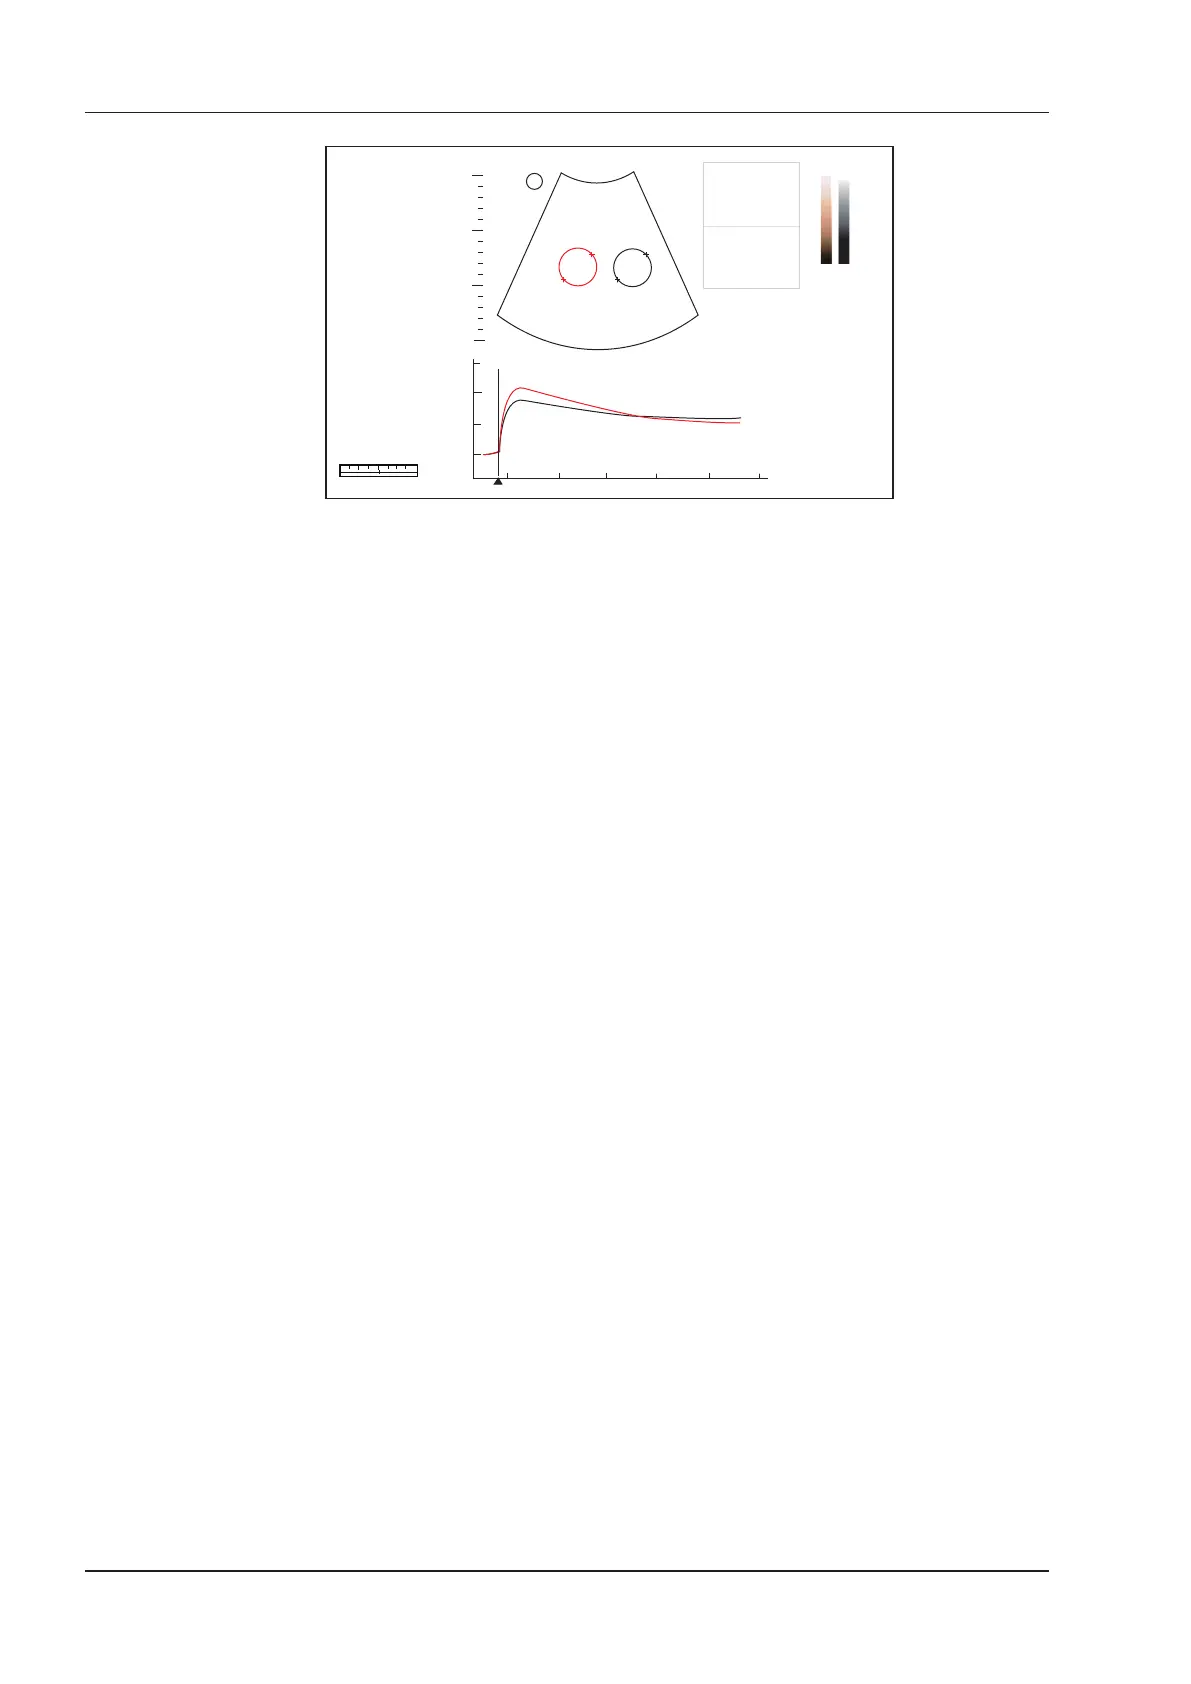
Figure 8-3 TIC Analysis Screen
−
X axis is the contrast agent duration, represents in s.
−
Y axis represents the contrast agent intensity, represents in dB.
You can press the Clear key on the control panel to delete all ROIs and TIC curves.
3. Analyze TIC curves for more information about circulation and perfusion.
Use the trackball to observe contrast images frame by frame, the indication line on the corresponding TIC
varies with the frame.
4. Tap
Exit
on the touch screen to return to the contrast imaging screen.