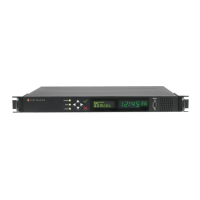
Figure 3-5: TimeKeeper Timing Quality tab
3.6.7.4 TKL "Time Map" Tab
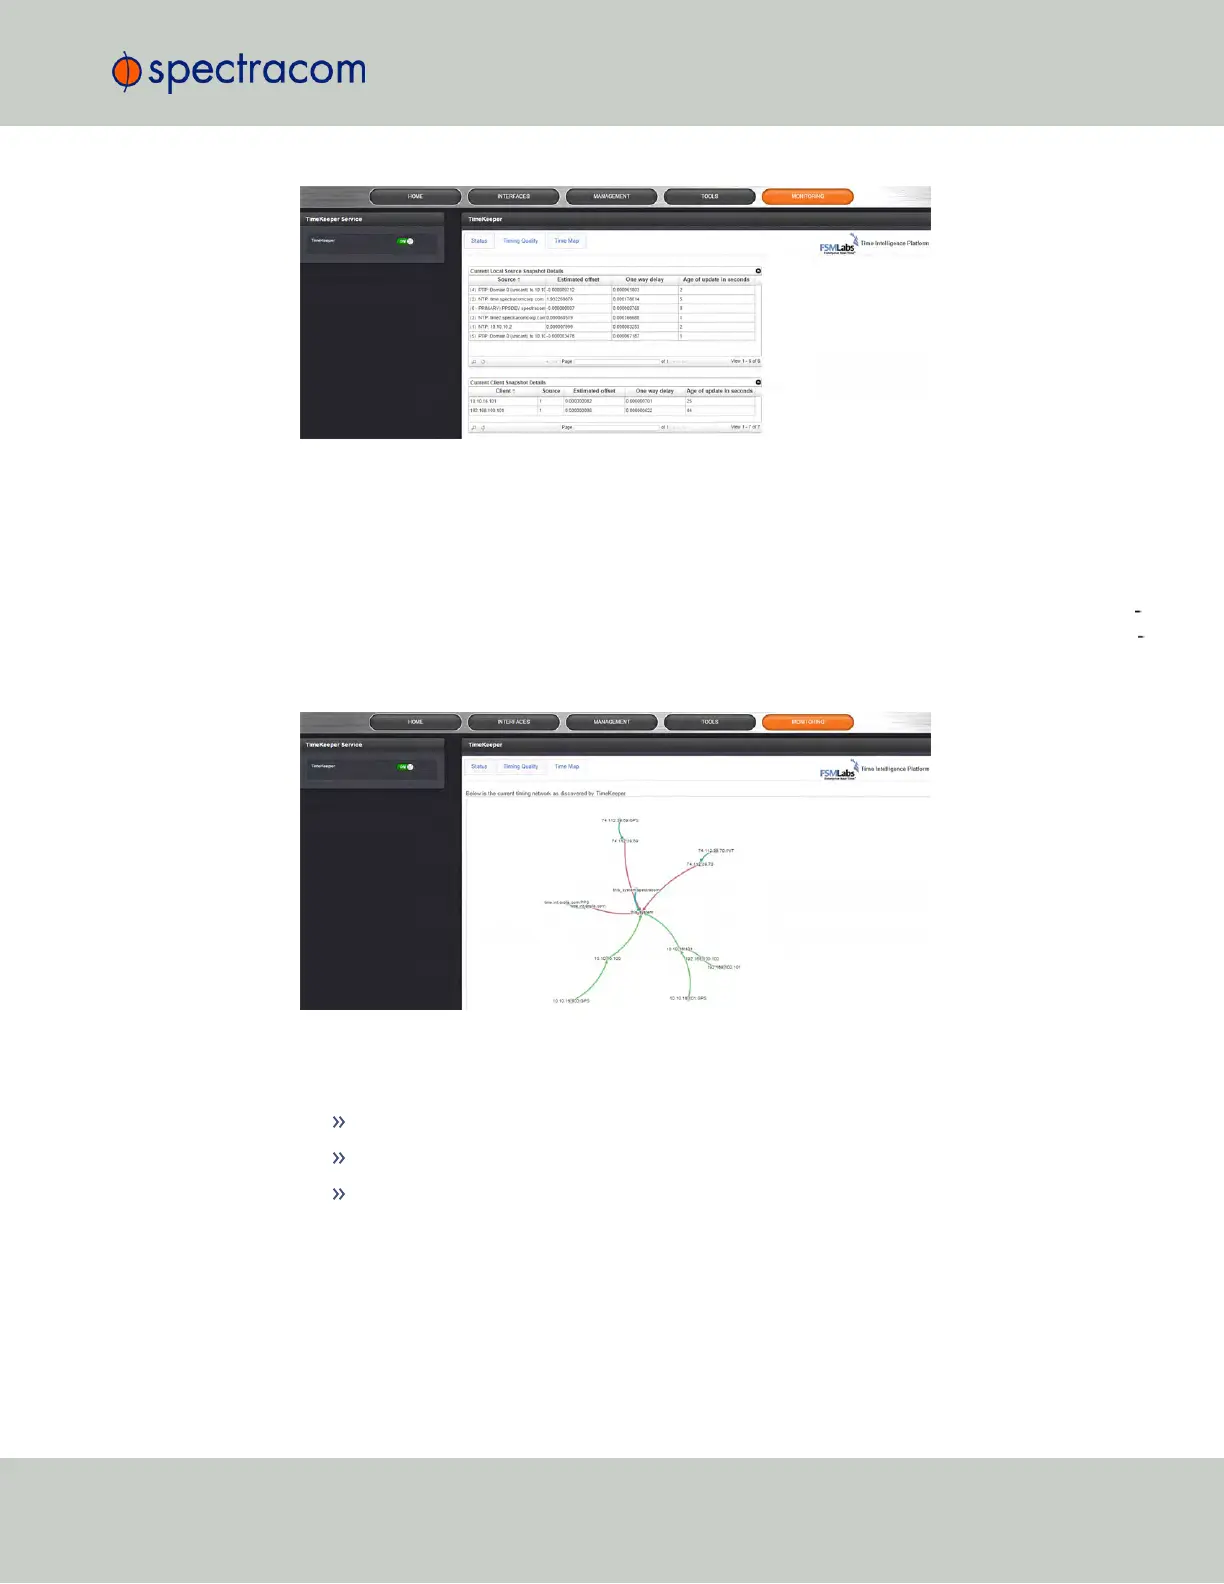
Under the Time Map tab, TimeKeeper TKL visualizes the structure of the timing network envir
onment, including all time sources, and other clients found on the network. Particularly with com
plex networks, this visualization tool can be of assistance when it comes to identifying
architectural or accuracy problems.
Figure 3-6: TimeKeeper Time Map tab
The connecting lines are color-coded:
Red: NTP
Green: PTP
Blue: direct
Drag any node or time source with your computer mouse to adjust the graph.
Use the mouse wheel to zoom in or out.
Scroll to the bottom of the page to see additional features, such as static display and hiding
labels.
3.6 Managing TimeKeeper
CHAPTER 3 • SecureSync User Reference Guide Rev. 23
213