lion (PPM); e.g. 290PPM is equivalent to .0290percent.
5.
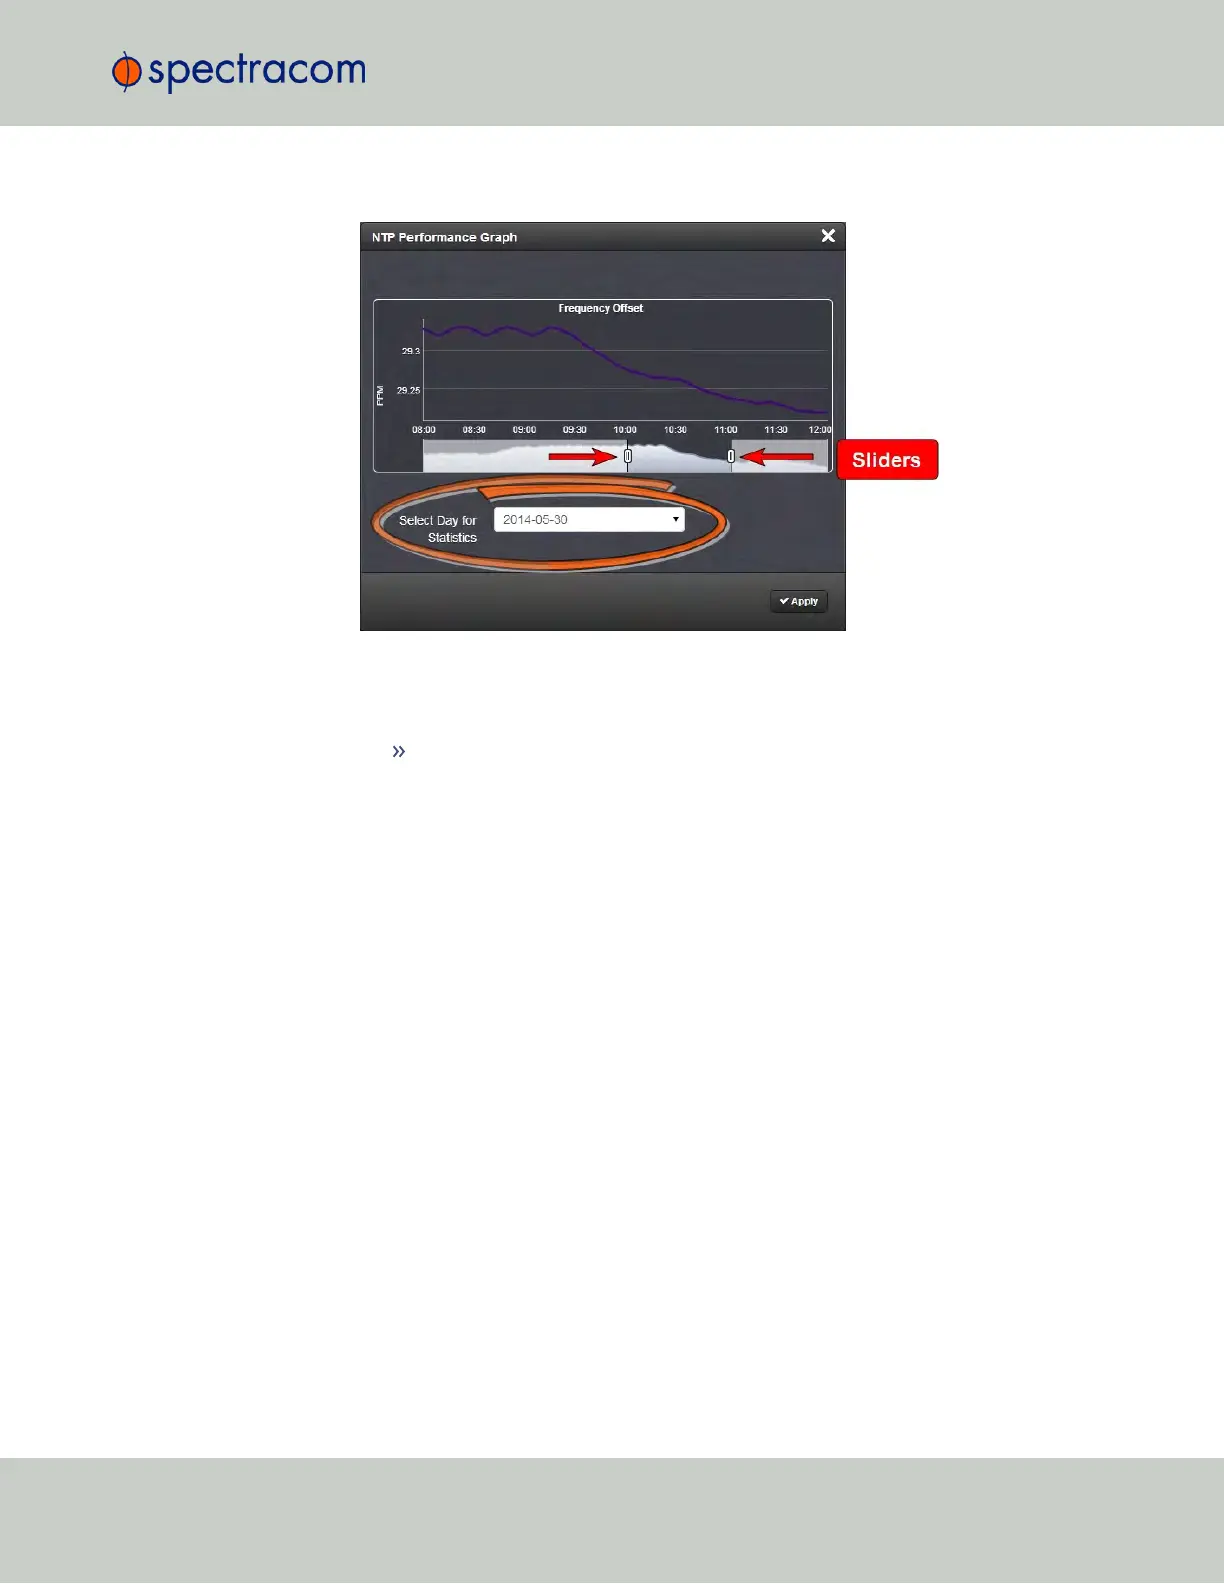
To select the statistics for a particular day, select a date from the drop-down list in the
Select Day for Statistics field (highlighted in green in the illustration above). The default
date is the present date. Click the Apply button.
To display a higher resolution graph of a shorter time frame, move one or both
of the two sliders inwards.
The NTP Jitter Performance Graph
To view the NTP Jitter performance graph:
4.5 Quality Management
CHAPTER 4 • SecureSync User Reference Guide Rev. 23
279