890370_0•en•01.06.2009 We reserve the right to carry out improvements
89
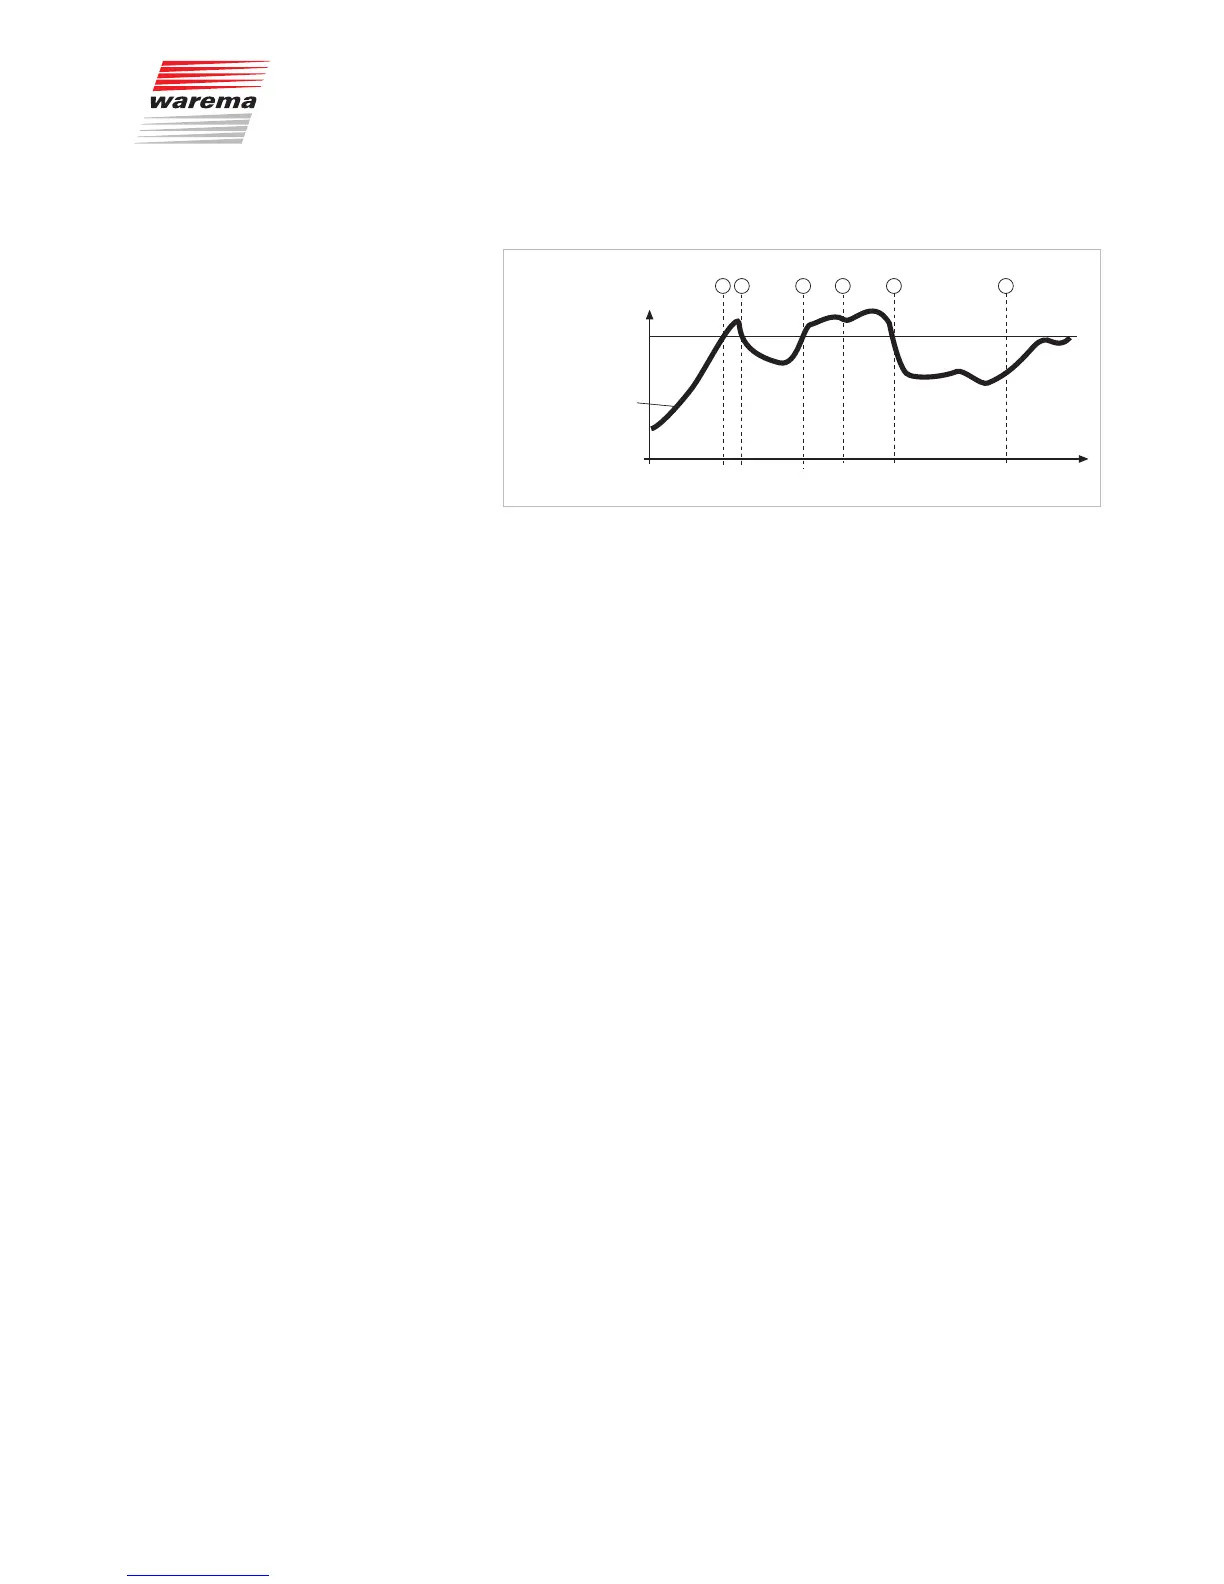
Example The following diagram illustrates the significance of the individual parameters:
Speed curve
Wind speed in m/s
Set limit value "WIND"
Time
< 5 s
= 5 s= 10 min
Delay "WIND"
Delay
“WIND OFF”
Delay "WIND"
1 2 3 4 5 6
Fig. 28 Wind speed and movements
The bold black curve represents the wind speed and the horizontal line the
set limit value for raising the sun shading product. The vertical, broken lines
indicate the on and off delay times. If you set an on delay time of 5 seconds,
an off delay time of 10 seconds and position 0% (top), the sun shading prod-
uct will respond as follows:
The wind speed increases until point
a
of the curve is reached; the "Limit
value WIND" is reached here. The "Delay WIND" now begins to run and your
sun shading product is not yet raised.
At point
b
of the curve, the value drops below "Limit value WIND"; the delay
time is interrupted before it could elapse and the sun shading product re-
mains where it is.
The wind speed increases later on and at point
c
is still lower than the limit
value. The "Delay WIND" time now begins to run anew and your sun shading
product is not yet raised.
At point
d➊
the delay time has elapsed and the "Limit value WIND" is still ex-
ceeded - the sun shading product is now raised.
The wind slackens again, and the value drops below "Limit value WIND" at
point
e➊
However, the sun shading products does not move yet because the
off delay time starts first.
At point
f➊
the off delay has elapsed and the limit value is not yet reached.
The wind monitoring function now enables operation of the sun shading
product again.
As this illustrates, the use of delay times results in a comfortable control
of the sun shading product. They “quiet” the response of the control. As a
consequence, the sun shading product is not moved immediately every time
there is a change in wind speed.
Channels