NATURAL SOURCE MAGNETOTELLURICS
Section 13, Page 13 May 2002
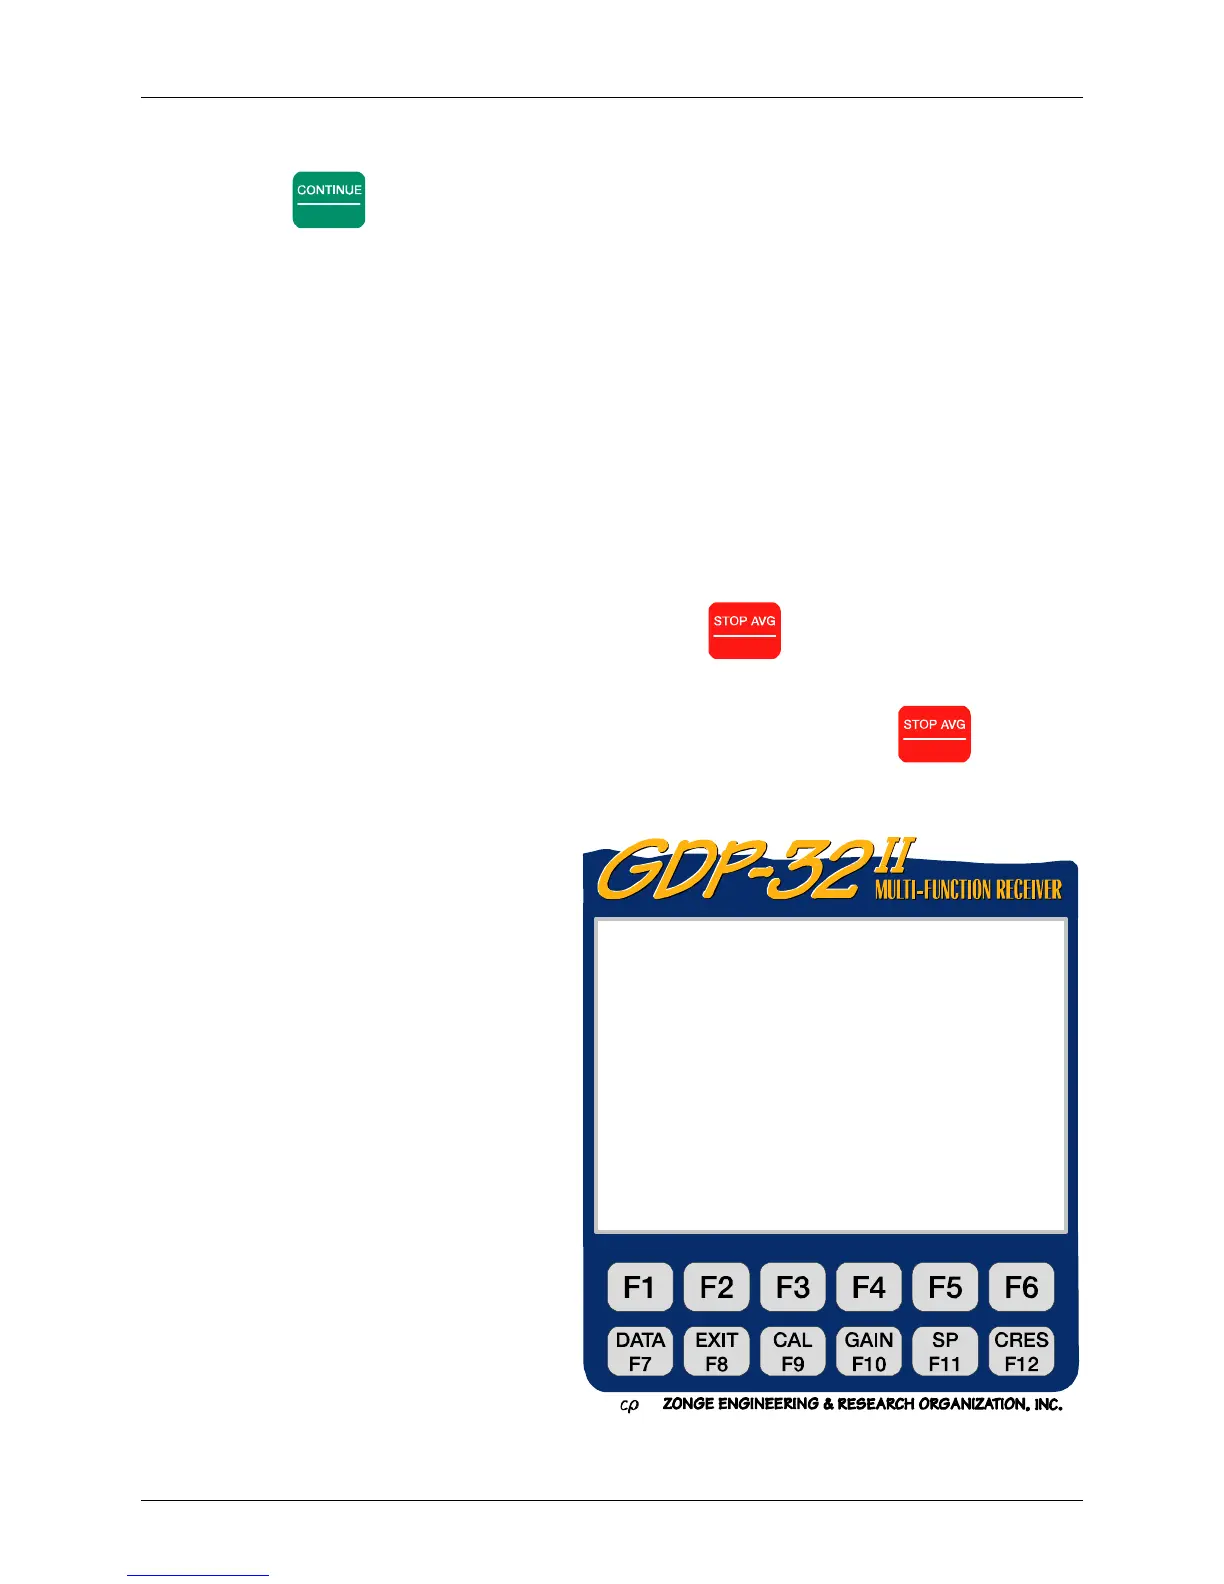
13.4 GATHERING DATA
Upon pressing
Enter
after the parameters are set up in Menu 4 the following screen display is
an example of what you will see with a signal connected to channels 1 through 4. The battery
voltage is measured and the A/D converter is automatically calibrated before each measurement
cycle.
For this example, we will set the frequency band to .0938 - 4 Hz, set the number of stacks to
acquire to 5, set the external preamplifier gains to 1, and just turn on the first four channels in a
vector configuration. The signal source for the following examples is the pseudorandom noise
source from a Tektronix 2642A Fourier Analyzer set to 1 mV RMS output with a 1 KHz
bandwidth and an additional RC network to modify the signals to Ch 3 and 4 (Ey, Hx).
The program will first set up the gains using all three gain stages, buck out the SP automatically
and then continue to gather data. The very "noisy" gain mode in MT/AMT adjusts the gains
until a signal level of 0.5 volts is obtained, starting with gain stage 0 (G0).
The program will acquire and save one stack of time series data at a time (8285 data points in
this example) until the stack count is complete or until the
Escape
key is pressed.
The display during data acquisition will appear as the following figure. The gains will be
displayed, but no data will appear until a complete time series is acquired or
Escape
is pressed.
For the low frequency band, the point count will change in increments of about 64 points as data
are acquired.
ACQUIRING DATA:
0097 AMT 0538 12.3 15 Mar 98 09:05:10
Survey Vector AMT
Tx 1 Rx 1 N OUT
.0938- 4 / 5 Stacks
6 Levels Point Count: 256/ 8285
CH Sta/Ant G0 G1 G2 Atn SP GGGA
1Ex 1 16 16 16 OUT 13.55 444O
2Hy 14161616OUT 7.86444O
3Ey 1 16 16 16 OUT 5.65 444O
4Hx 24161616OUT 6.36444O
5OFF
6OFF
7OFF
8OFF
Taking data
PREV NEXT