TIME DOMAIN INDUCED POLARIZATION (TDIP)
Section 9, Page 13 May 2002
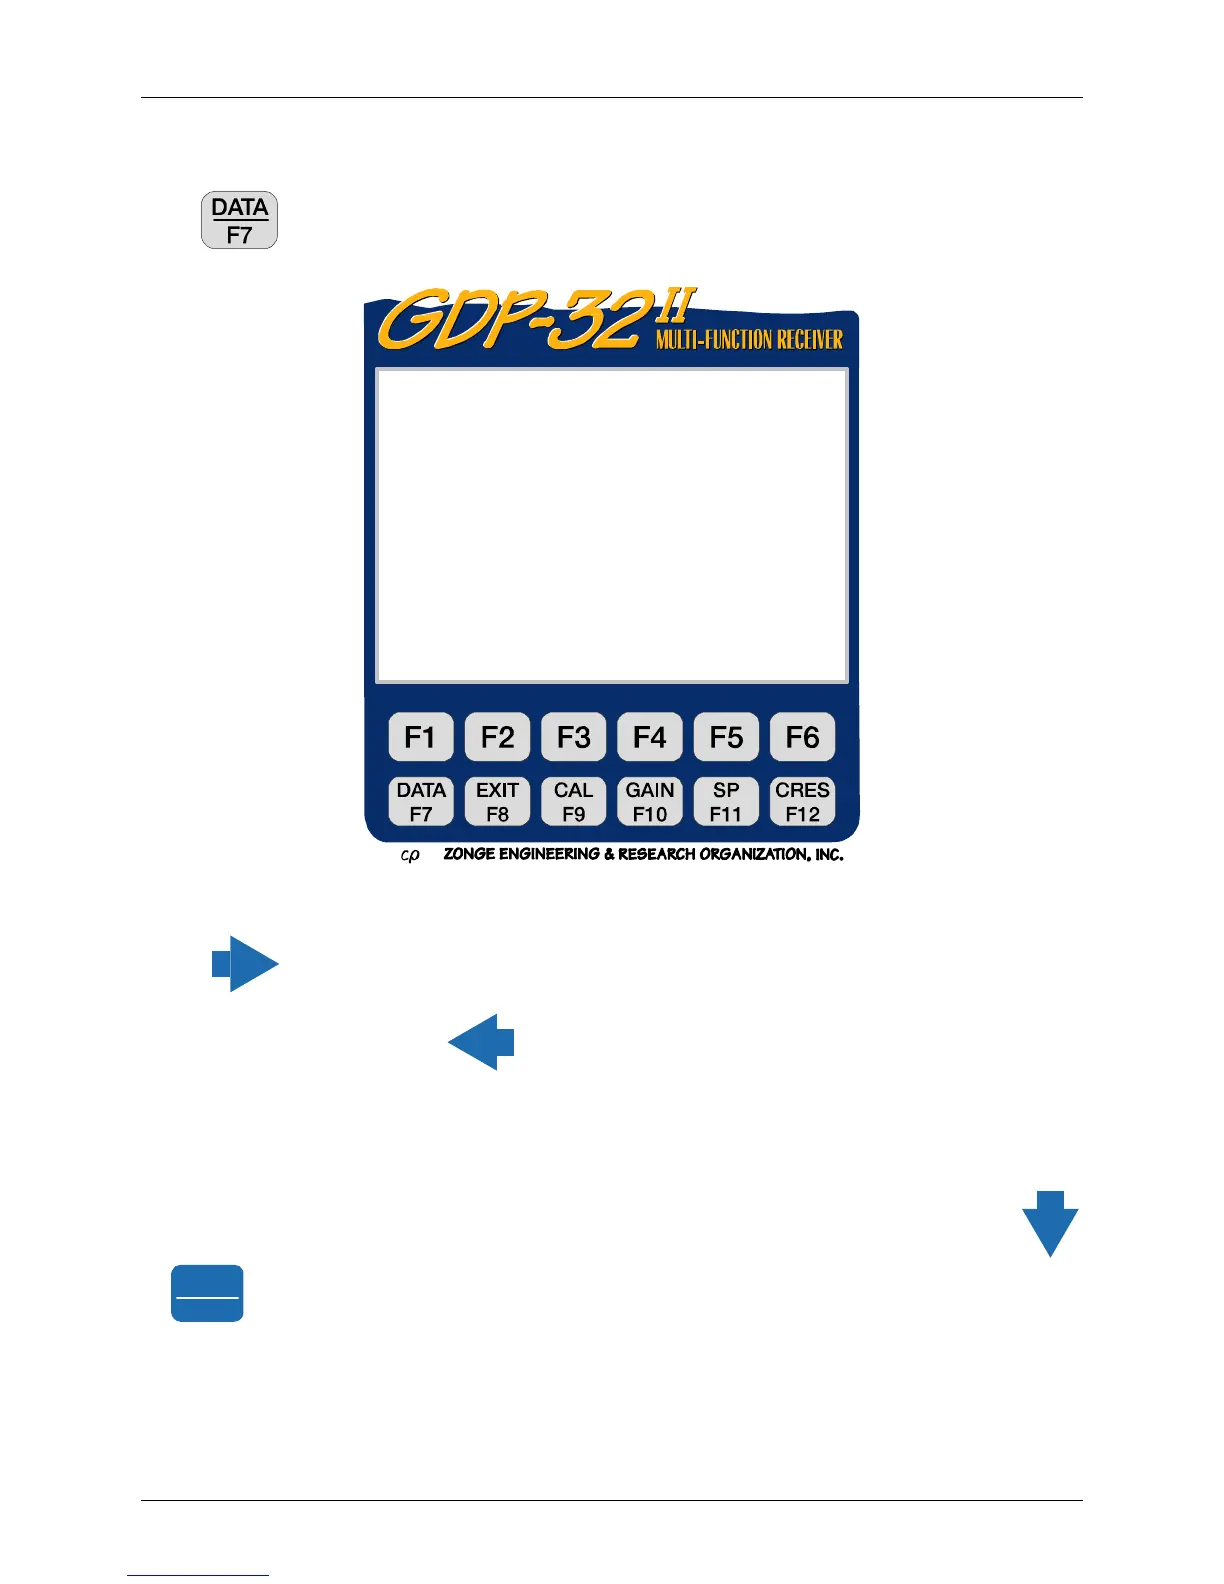
VIEWING DATA
Press
to display the last stack. The data display is in the following format:
The contact resistance values have been saved, but are off the screen to the right. To view these
values
several times.
To move back to the left, press
NOTE: The Gains data column includes an Attenuator setting of O for OUT or I for IN.
The windows data are integrated voltages (using 19 data points) and normalized by Vp and 19
(the number of data points) for each of 13 windows. See the following section for window
specifications. When first entering data mode, only the first four windows appear. Press
or
Pg Dn
NEXT FIELD
to view the rest of the windows.
Block: 0212 Total: 0212
TDIP0613 2000-01-18 13:50:31 11.7v D-D 26.7% 30.0DegC
Tx 1 Rx 3 N OUT
.125 Hz 4/ 4 Cycles Tx Curr 1
CH N MAG
I
rho GGGA SEM SP
1 ON 1 0.9999 0.0 1886 000O 0.02 -7.14
2 ON 2 1.0008 –0.0 7542 000O 0.01 -3.85
3 OFF
4 OFF
Select Block Plot Skip
Block 0208 Data Flag