Chapter 5: Running Samples Manually 107
2 On your Experiment document, create the required number of plots;
change all plots to Acquisition -> Analysis.
• Press Command-A.
• In the Inspector, choose Acq -> Analysis from the Plot Type menu.
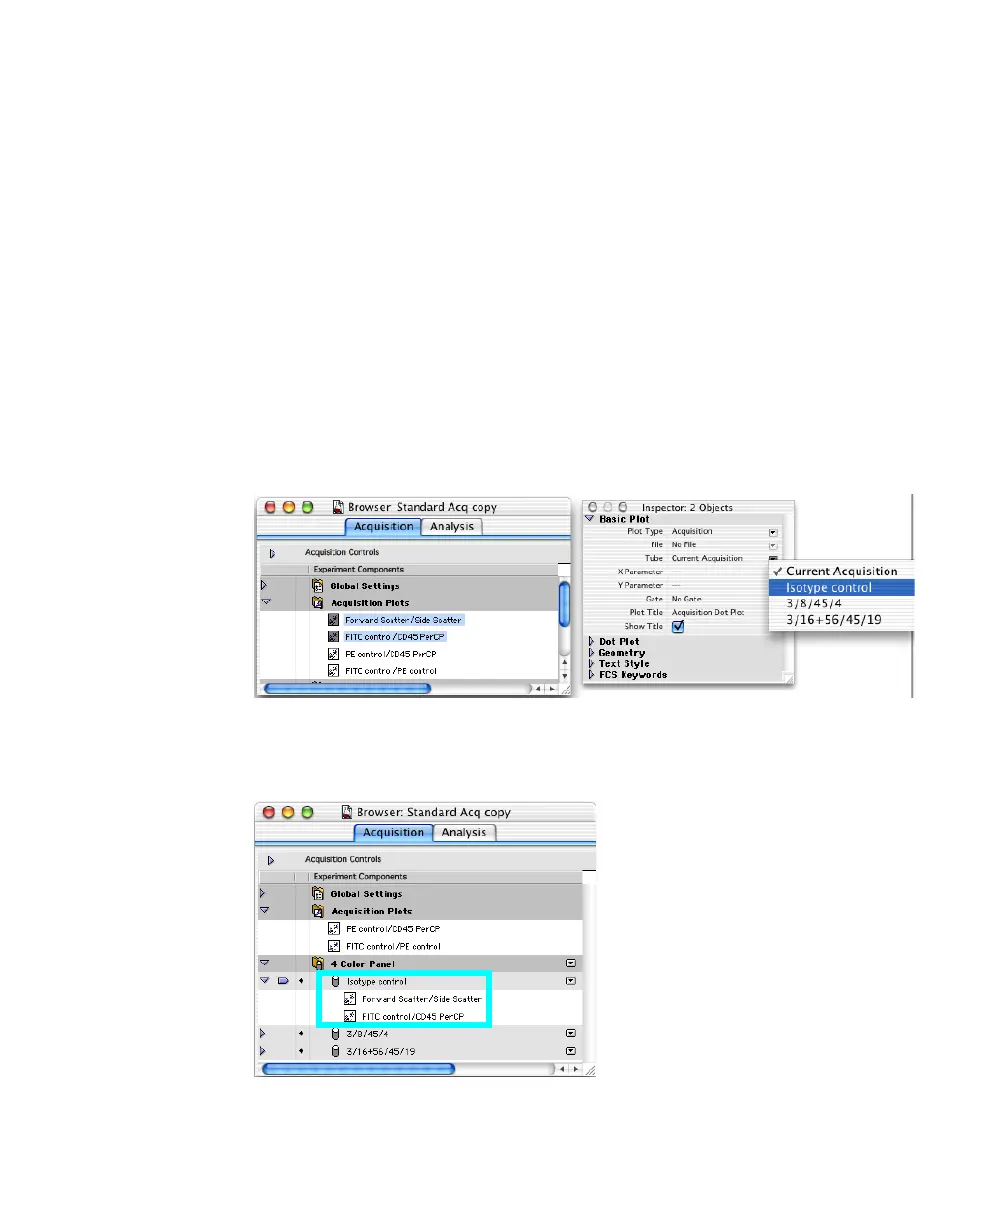
3 Select one or more plots in the Experiment document or Acquisition Browser.
To display plots in the Browser, click the disclosure triangle next to the
Acquisition Plots folder. Select multiple items by pressing the Shift key as
you click.
4 In the Inspector, click the Tube pop-up menu and choose the tube you want
to associate with the selected plots.
The associated plots are listed under the acquisition tube name in the
Browser: