88 BD FACSCalibur Instructions for Use
5 For 4-color experiments, add an FL3 vs FL4 plot to the document.
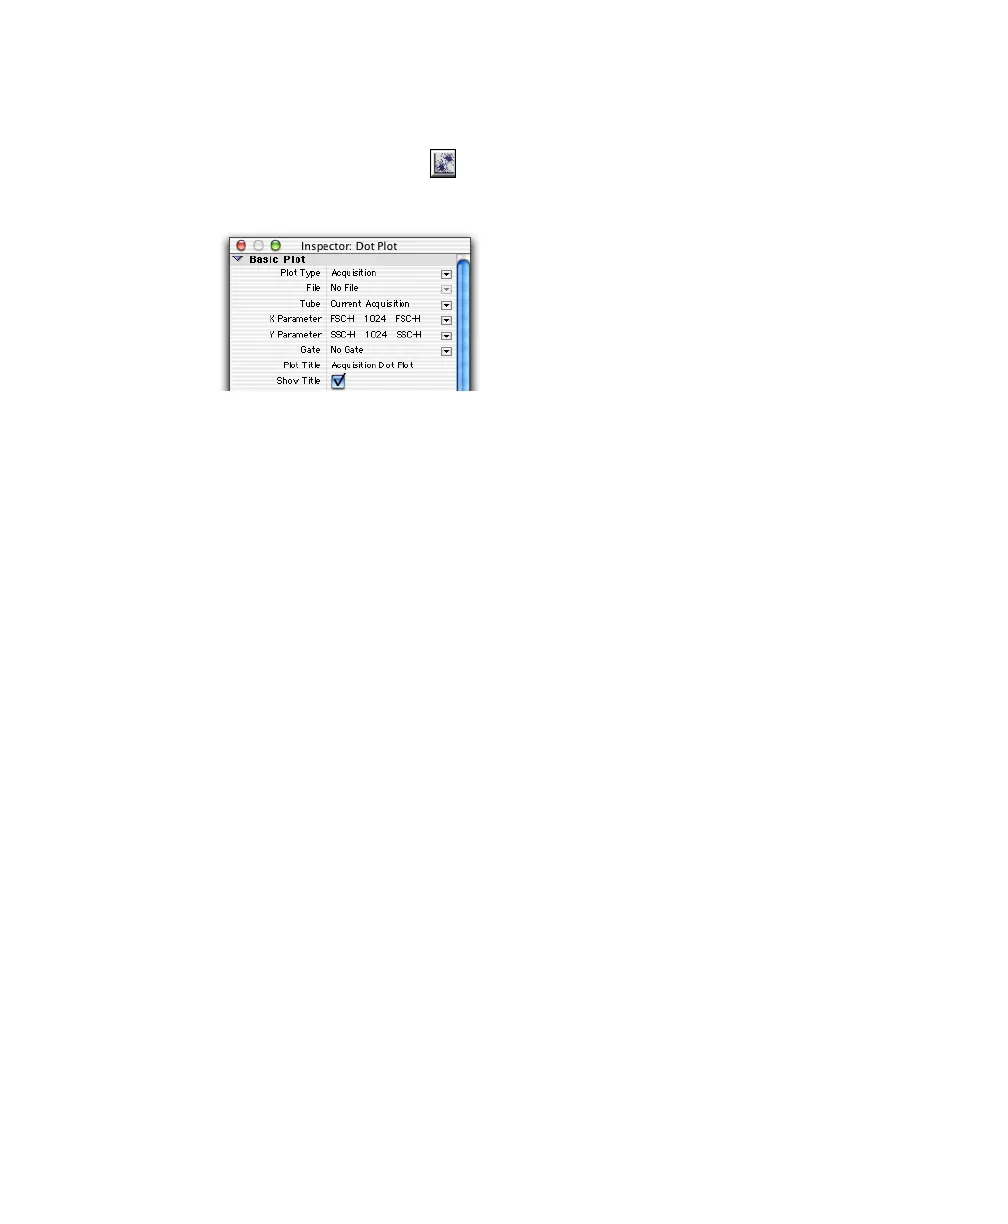
Select the Dot Plot tool ( ), click in the Experiment document window,
and drag to set the plot size. Along with the plot, the Inspector appears:
The contents of the Inspector change, depending on the object(s) selected.
In this case, the Inspector shows dot plot options.
6 In the Inspector window, make sure the Plot Type is Acquisition.
Plots can be Acquisition, Analysis, or Acquisition-to-Analysis.
• Acquisition plots can be histograms, dot plots, or density plots. These
plots are used to display live data while optimizing instrument
electronics and to define the conditions for data collection and storage.
• Analysis plots can be histograms, dot, density, contour, or 3D plots.
These plots are used to display saved data files. Data can be analyzed
by creating regions, setting markers, and generating statistics.
• Acquisition-to-analysis plots can be histograms, dot plots, or density
plots. These plots change from an acquisition plot to an analysis plot
after data acquisition is complete. The data from the file just acquired
appear in the plot with any formatting defined during acquisition, for
example, regions, markers, or colors.