Chapter 5: Running Samples Manually 93
Gating the Population of Interest
Cell populations in a sample can have different light scatter and autofluorescent
properties. By gating the population of interest, fluorescence detector settings will
account for the autofluorescence and nonspecific binding of these cells.
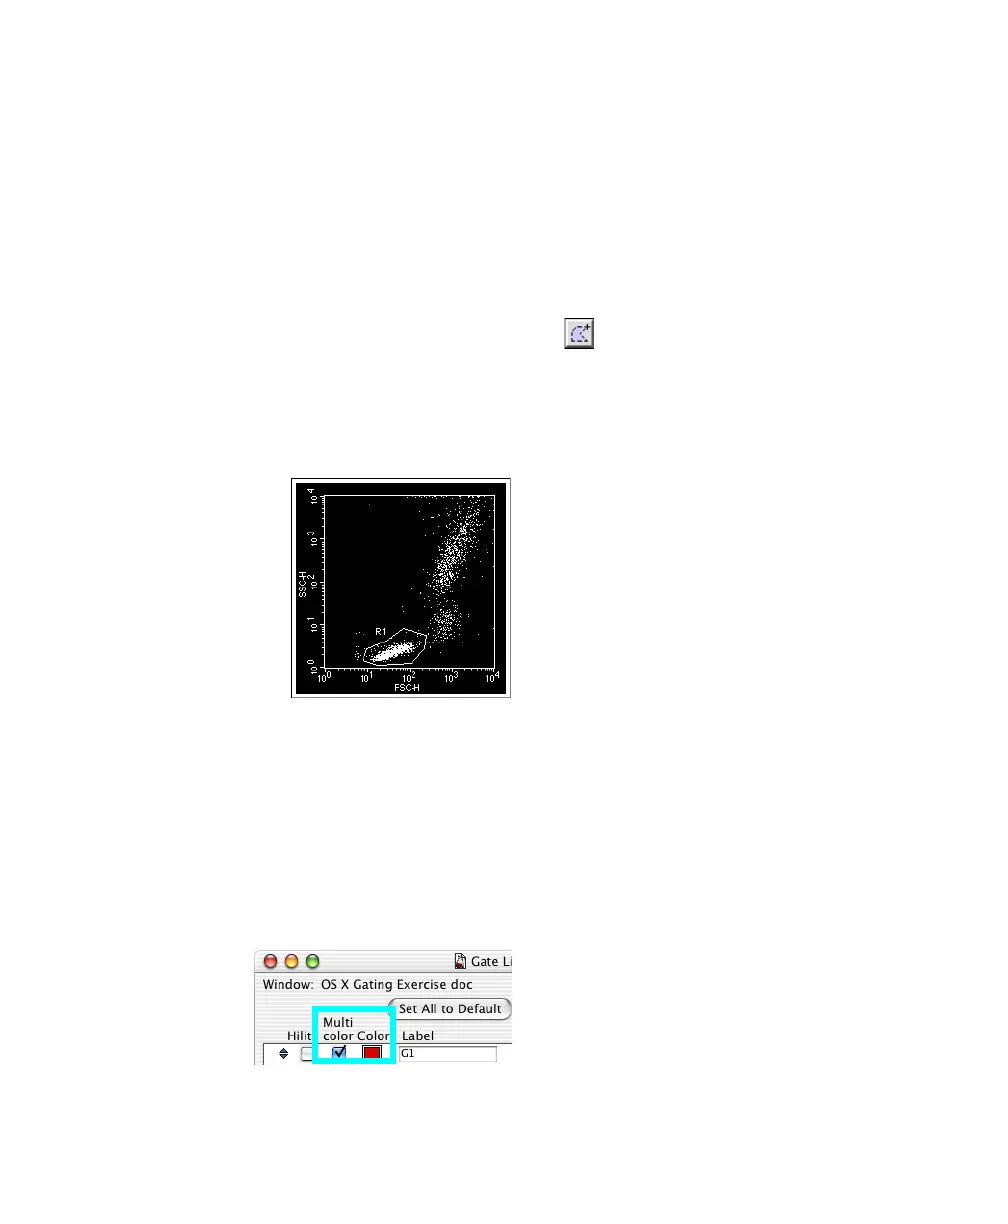
1 Create a polygon region around the lymphocyte population in the FSC vs
SSC plot.
• Select the Polygon-Region tool ( ).
• Click around the population of interest until the region is complete.
• Close the region by double-clicking the last vertex or clicking the first.
; Tip To prevent data from being obscured by the region label, click outside
the region to deselect it and then drag the label outside the region.
2 (Optional) Change the color of the gated population.
Choose Gates > Gate List, and select the Multicolor checkbox. The gated
events change to the color shown in the Color box. To change the color,
click the Color box and choose a new color.