DMD1050TS Satellite Modem Board
Revision 1
Web Browser 7–72 MN-DMD1050TS
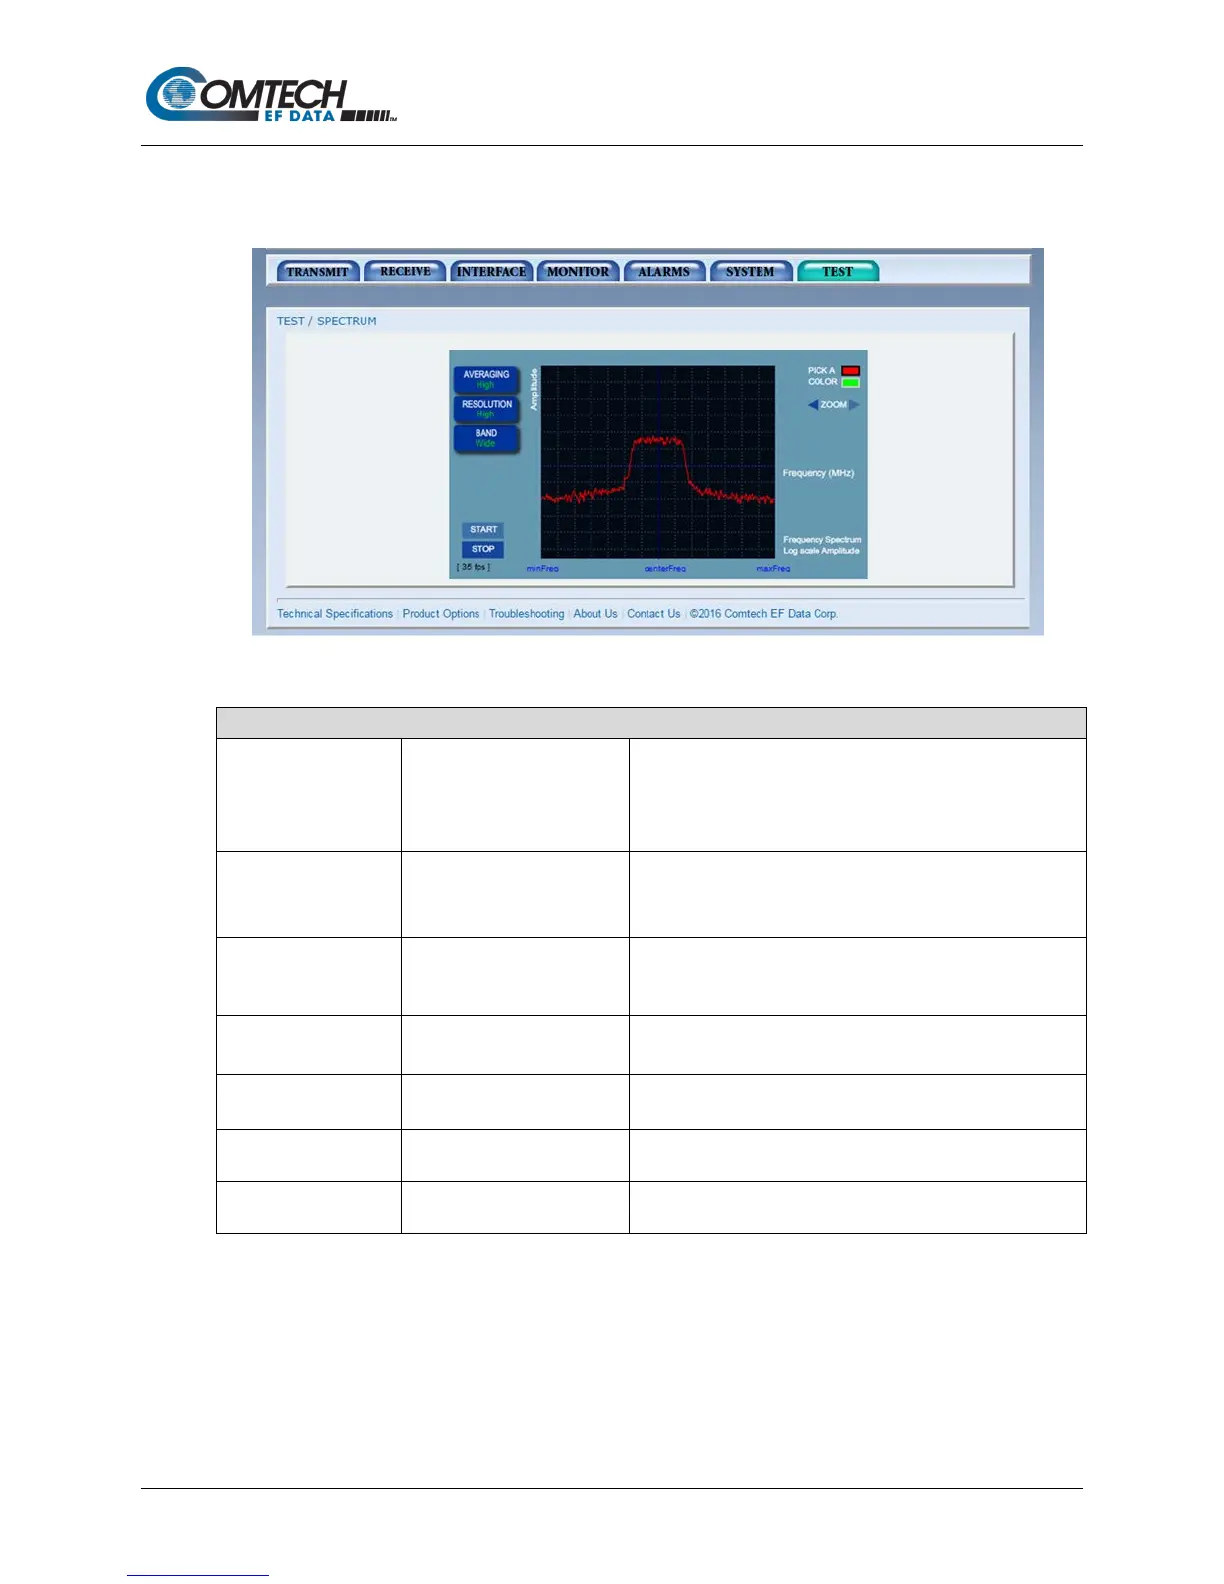
7.7.6.3 Test | Spectrum Plot Page
The Spectrum Plot page shows the RX Input spectrum sampled data as seen by the receiver,
with a center frequency of the receiver’s tuned frequency.
Figure 7-40. Test | Spectrum Plot Page Example
Test | Spectrum Plot Page
AVERAGING • Off
• Low
• Medium
• High
Hover over the AVERAGING button to display the
selections. Click on one of the selections, and then it will
appear in green on the AVERAGING button.
•
• Medium
• High
Hover over the RESOLUTION button to display the
selections. Click on one of the selections, and then it will
appear in green on the RESOLUTION button.
•
• Wide
Hover over the BAND button to display the selections. Click
on one of the selections, and then it will appear in green on
the BAND button.
PICK A COLOR • RED
• GREEN
Use to select color preference.
After starting the test, use the arrows on either side of
ZOOM to zoom in / out of the graph.
START Use to run the Spectrum Plot.
Use to end the Spectrum Plot.