448 Viewing Statistics and Remote Monitoring
LAG Statistics
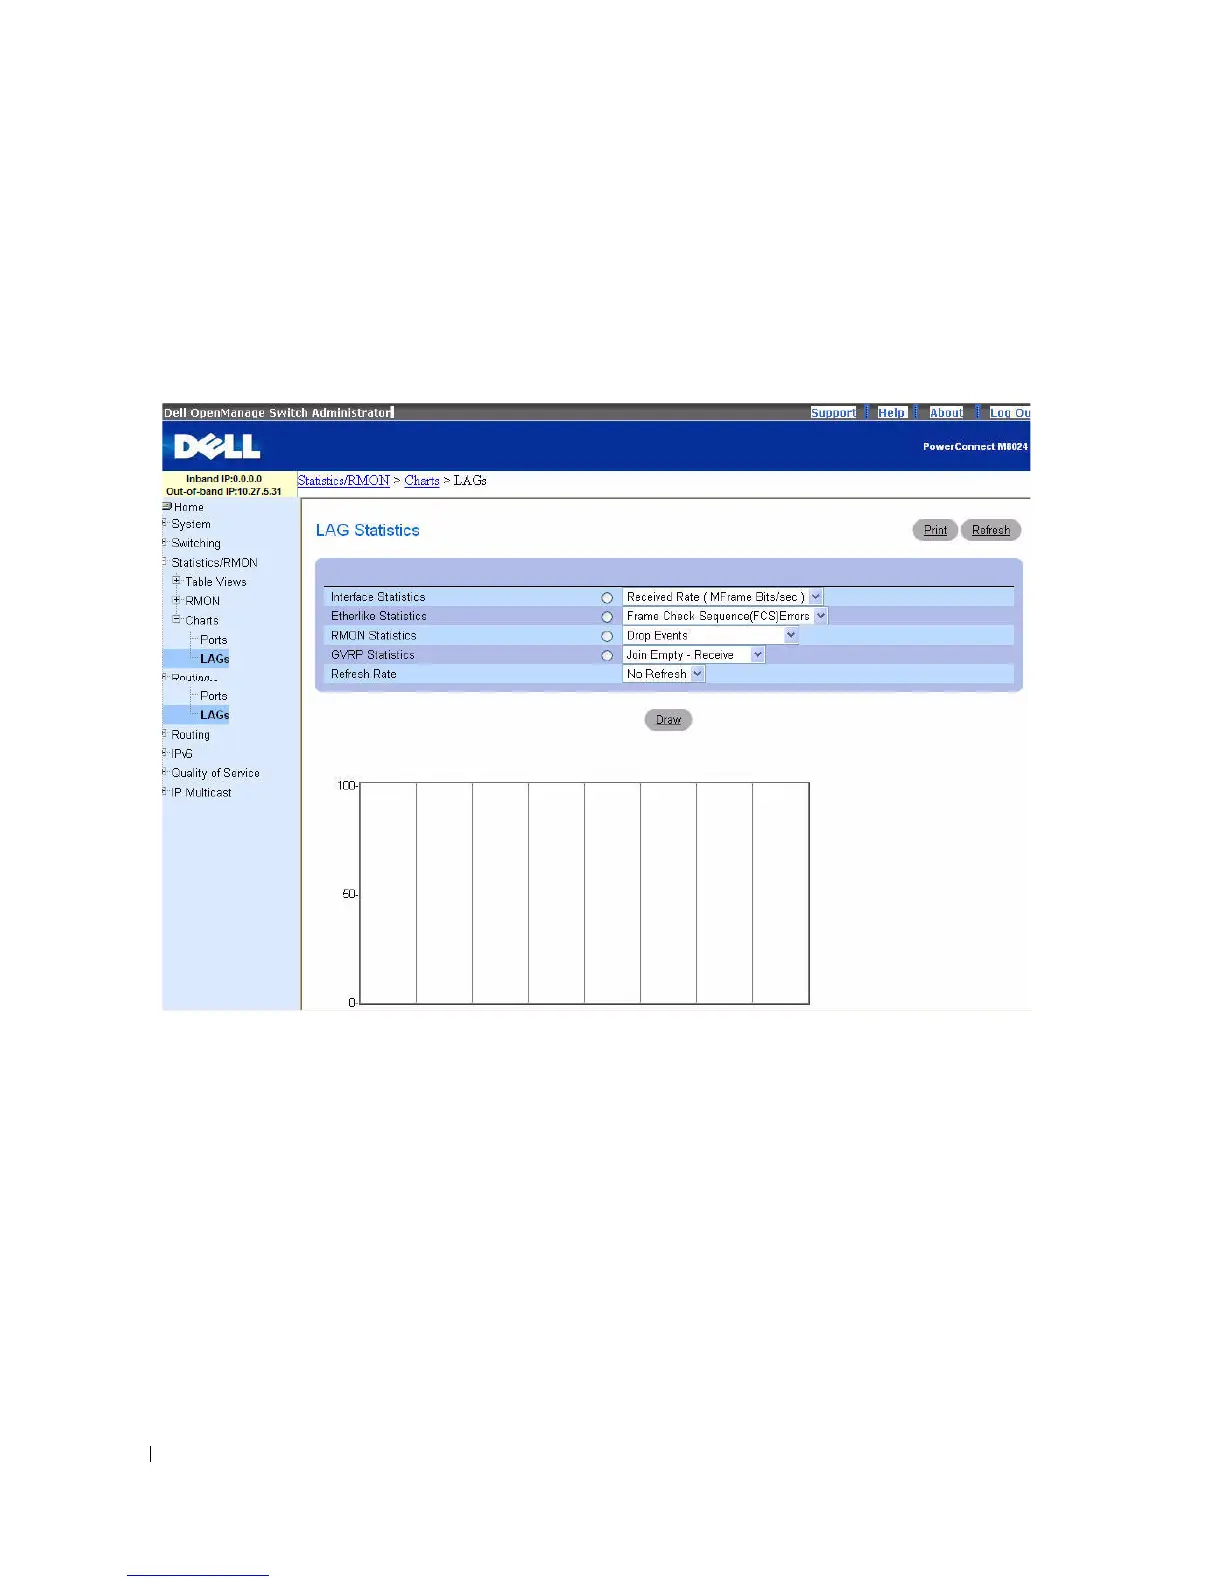
Use the LAG Statistics page to chart LAG-related statistics on a graph.
To display the page, click Statistics/RMON > Charts > LAGs in the tree view.
Figure 8-20. LAG Statistics
The LAG Statistics page contains the following fields:
•
Interface Statistics
— Selects Interface Statistics when clicked, and specifies the type of interface
statistics to graph from the drop-down menu. The default is Received Rate.
•
Etherlike Statistics
— Selects Etherlike Statistics when clicked, and specifies the type of etherlike
statistics to graph from the drop-down menu. The default is Frame Check Sequence Errors.
•
RMON Statistics
— Selects RMON Statistics when clicked, and specifies the type of RMON statistics
to graph from the drop-down menu. The default is Drop Events.
•
GVRP Statistics
— Selects GVRP Statistics when clicked, and specifies the type of GVRP statistics to
graph from the drop-down menu. The default is Join Empty - Receive.
•
Refresh Rate
— Selects the amount of time that passes before statistics are refreshed. The possible
field values are No Refresh, 15, 30 and 60 seconds. The default rate is 15 seconds.