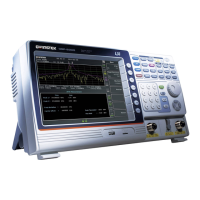
The Spectrogram view shows signals in both
the frequency and time domain. The X-axis
represents frequency, the Y-axis represents time
and the color of each point represents the
amplitude at a particular frequency & time
(Red = high dark blue = low).
Each new trace is shown at the bottom of the
display and older traces are pushed up toward
the top of the display until they are removed.
 Loading...
